Flax Fibre Fineness and Linear Density Determination Methods
Verify flax linear density using ISO 1973 cut-and-weigh gravimetry at standard 12% regain to accurately forecast wet-spinning limits and enforce contract pricing.


Gauge
Pressure differential measurements across a packed chamber of scutched flax expose structural variation long before the sliver ever reaches a drafting zone. Bast fibres aren’t uniform, smooth cylinders; they are complex technical bundles of elementary cells held together by middle lamella pectins. When testing long-staple line flax or scutched tow with air permeability equipment, the instrument measures the total surface area of these bundles within a compressed plug.
Standard airflow methods adapted from cotton Micronaire systems give misleading values when calibrated directly against cotton standards. The high aspect ratio of flax technical bundles ~ combined with erratic lumen collapse and residual epidermal tissue ~ requires modified chamber geometries and adjusted mass charges to produce reliable surface area readings.
Determining flax fineness by air permeability relies on the Kozeny-Carman relationship, which links fluid resistance in a porous bed to the specific surface area of the packed filaments. Standard testing under ISO 2370 uses either a constant airflow rate or a fixed pressure drop across a cylindrical test chamber. A five-gram specimen plug, cut into uniform segments between 10 millimetres and 25 millimetres, is compressed into a set volume.
As air moves through the sample, finer fibres present a larger total surface area, offering more resistance and driving up the pressure drop. Coarse or under-retted technical bundles offer less surface area per unit mass, letting air pass with lower resistance. In practice, failing to comb out loose shive fragments before packing the chamber distorts fluid channel distribution, artificially dropping the measured pressure drop by up to fourteen percent.

Air Permeability Principles in Bast Fibre Assessment
Airflow resistance depends on total surface area per unit volume. Individual flax filaments range from 10 micrometres to 25 micrometres in diameter, while technical bundles run anywhere from 40 micrometres to well over 120 micrometres. Air permeability measures the equivalent aerodynamic diameter of this bundle group.
Because flax cross-sections are irregular ~ varying from polygonal to flattened oval profiles with narrow central lumens ~ specific surface area per unit mass (Sw) tracks how thoroughly the bundles were separated during retting and scutching. Fine, well-divided technical flax gives high specific surface area values above 0.45 square metres per gram, while coarse, stiff stock falls below 0.22 square metres per gram. These values convert directly into aerodynamic fineness units, typically reported as an air permeability index or an equivalent metric fibre number.
Calibration depends heavily on uniform packing density. Loose plugs create channeling along chamber walls, allowing air to bypass the central core of the sample. Tight plugs crush individual filaments together, hiding surface area from the air stream and producing artificially fine readings.
High-precision instruments prevent this with constant-volume chambers and mechanical plungers locked to tight tolerances. Air entering the chamber must be kept at exactly 20 degrees Celsius and 65 percent relative humidity. Temperature swings shift air viscosity, while humidity changes alter fibre swelling, directly distorting the pressure differential recorded by the transducers.
Dew-retted line flax at 12% moisture regain yields an airflow density equivalent of 1.65 tex per elementary strand under standard ISO 2370 chamber compression.

Airflow Resistance Differential across Fiber Grades
Testing requires strict control over sample mass and compaction volume. Protocols call for loading a precise specimen charge into the holder, followed by uniform axial compression. The resulting differential pressure ~ measured in millibars or inches of water column ~ translates into metric count or linear density through calibration curves derived from gravimetrically verified reference lots.
| Flax Fibre Grade | Average Bundle Width (μm) | Specific Surface Area (m²/g) | Pressure Differential (mbar) | Equivalent Linear Density (tex) | Target Wet-Spun Count (Nm) |
|---|---|---|---|---|---|
| Superfine Line (Water-Retted / Enzyme-Treated) | 35 ~ 45 | 0.48 ~ 0.55 | 14.2 ~ 16.5 | 1.2 ~ 1.6 | Nm 80 ~ Nm 110 |
| Standard High-Grade Line (French Dew-Retted) | 46 ~ 60 | 0.38 ~ 0.45 | 11.0 ~ 13.5 | 1.7 ~ 2.3 | Nm 50 ~ Nm 70 |
| Medium Commercial Line (Belgian Dew-Retted) | 61 ~ 75 | 0.30 ~ 0.36 | 8.2 ~ 10.5 | 2.4 ~ 3.2 | Nm 30 ~ Nm 45 |
| Coarse Hackled Tow (European Scutched) | 76 ~ 95 | 0.22 ~ 0.28 | 5.8 ~ 7.8 | 3.3 ~ 4.5 | Nm 18 ~ Nm 26 |
| Heavy Carded Tow (Under-Retted Stock) | 96 ~ 130 | 0.14 ~ 0.20 | 3.5 ~ 5.2 | 4.6 ~ 6.8 | Nm 10 ~ Nm 15 |
Airflow testing catches structural defects in raw fibre lots well before yarn formation. As shown in Table 1, pressure drop falls as bundle width increases, which lowers the maximum spinnable count. When high-grade French dew-retted flax registers pressure drop readings below 11.0 millibars, it contains too many coarse technical bundles to survive drafting zone extension during wet spinning.
This stock leads to frequent end breaks on the frame unless operators drop machine speeds or loosen draft ratios. Because airflow testing takes under two minutes per sample, it serves as a fast screening tool for incoming mill inspections compared to gravimetric cut-and-weigh routines.
Airflow accuracy relies on thorough sample blending. Raw fibres taken straight from scutched bales vary widely between root, mid-stem, and tip sections. Root sections feature thick cell walls and broad bundles, giving lower airflow resistance.
Tip sections run finer but carry more residual pectin and epidermal tissue. Preparing a proper test plug requires blending equal mass portions from root, middle, and tip on a hand card or laboratory mini-card before loading the chamber. Skipping this step introduces sample variance that throws off calibration curves and results in misgraded stock.
- Chamber Channeling Bypass occurs when stiff, uncarded flax bundles align parallel to the airflow, lowering pressure differential readings and falsely inflating reported fineness.
- Moisture Swell Artifact arises when ambient humidity exceeds 70 percent, swelling cell walls, closing bed porosity, and falsely indicating an overly fine grade.
- Shive Plug Obstruction occurs when coarse woody shive fragments get into the chamber bed, clogging air passages and producing artificially high pressure drops.
- Lumen Collapse Variability appears in prematurely harvested flax, whose hollow central channels flatten under vacuum pressure and distort calculated surface area figures.
Classers frequently point out that air permeability tools measure bundle surface geometry rather than actual chemical mass. Dew-retted line flax can register airflow readings corresponding to an Nm 70 spinnable count even when hand-grading reveals stiff, unretted pectin ribbons along the mid-stem. The instrument registers fine micro-cracks on the outer bark as high specific surface area, masking the heavy, unsplit core beneath.

Gravimetry
Directly weighing cut bundle segments provides the most reliable linear density metric available to a mill. Unlike air permeability or optical methods, gravimetric testing measures exact mass per unit length without making assumptions about fibre density, cross-sectional shape, or surface friction. Standardized under ISO 1973, direct weighing serves as the primary reference method for calibrating all benchtop instruments in bast fibre testing.
Because elementary fibres are bound into variable technical bundles, accurate gravimetric assessment requires meticulous sample preparation, microgram balance resolution, and strict climate control to prevent regain errors.
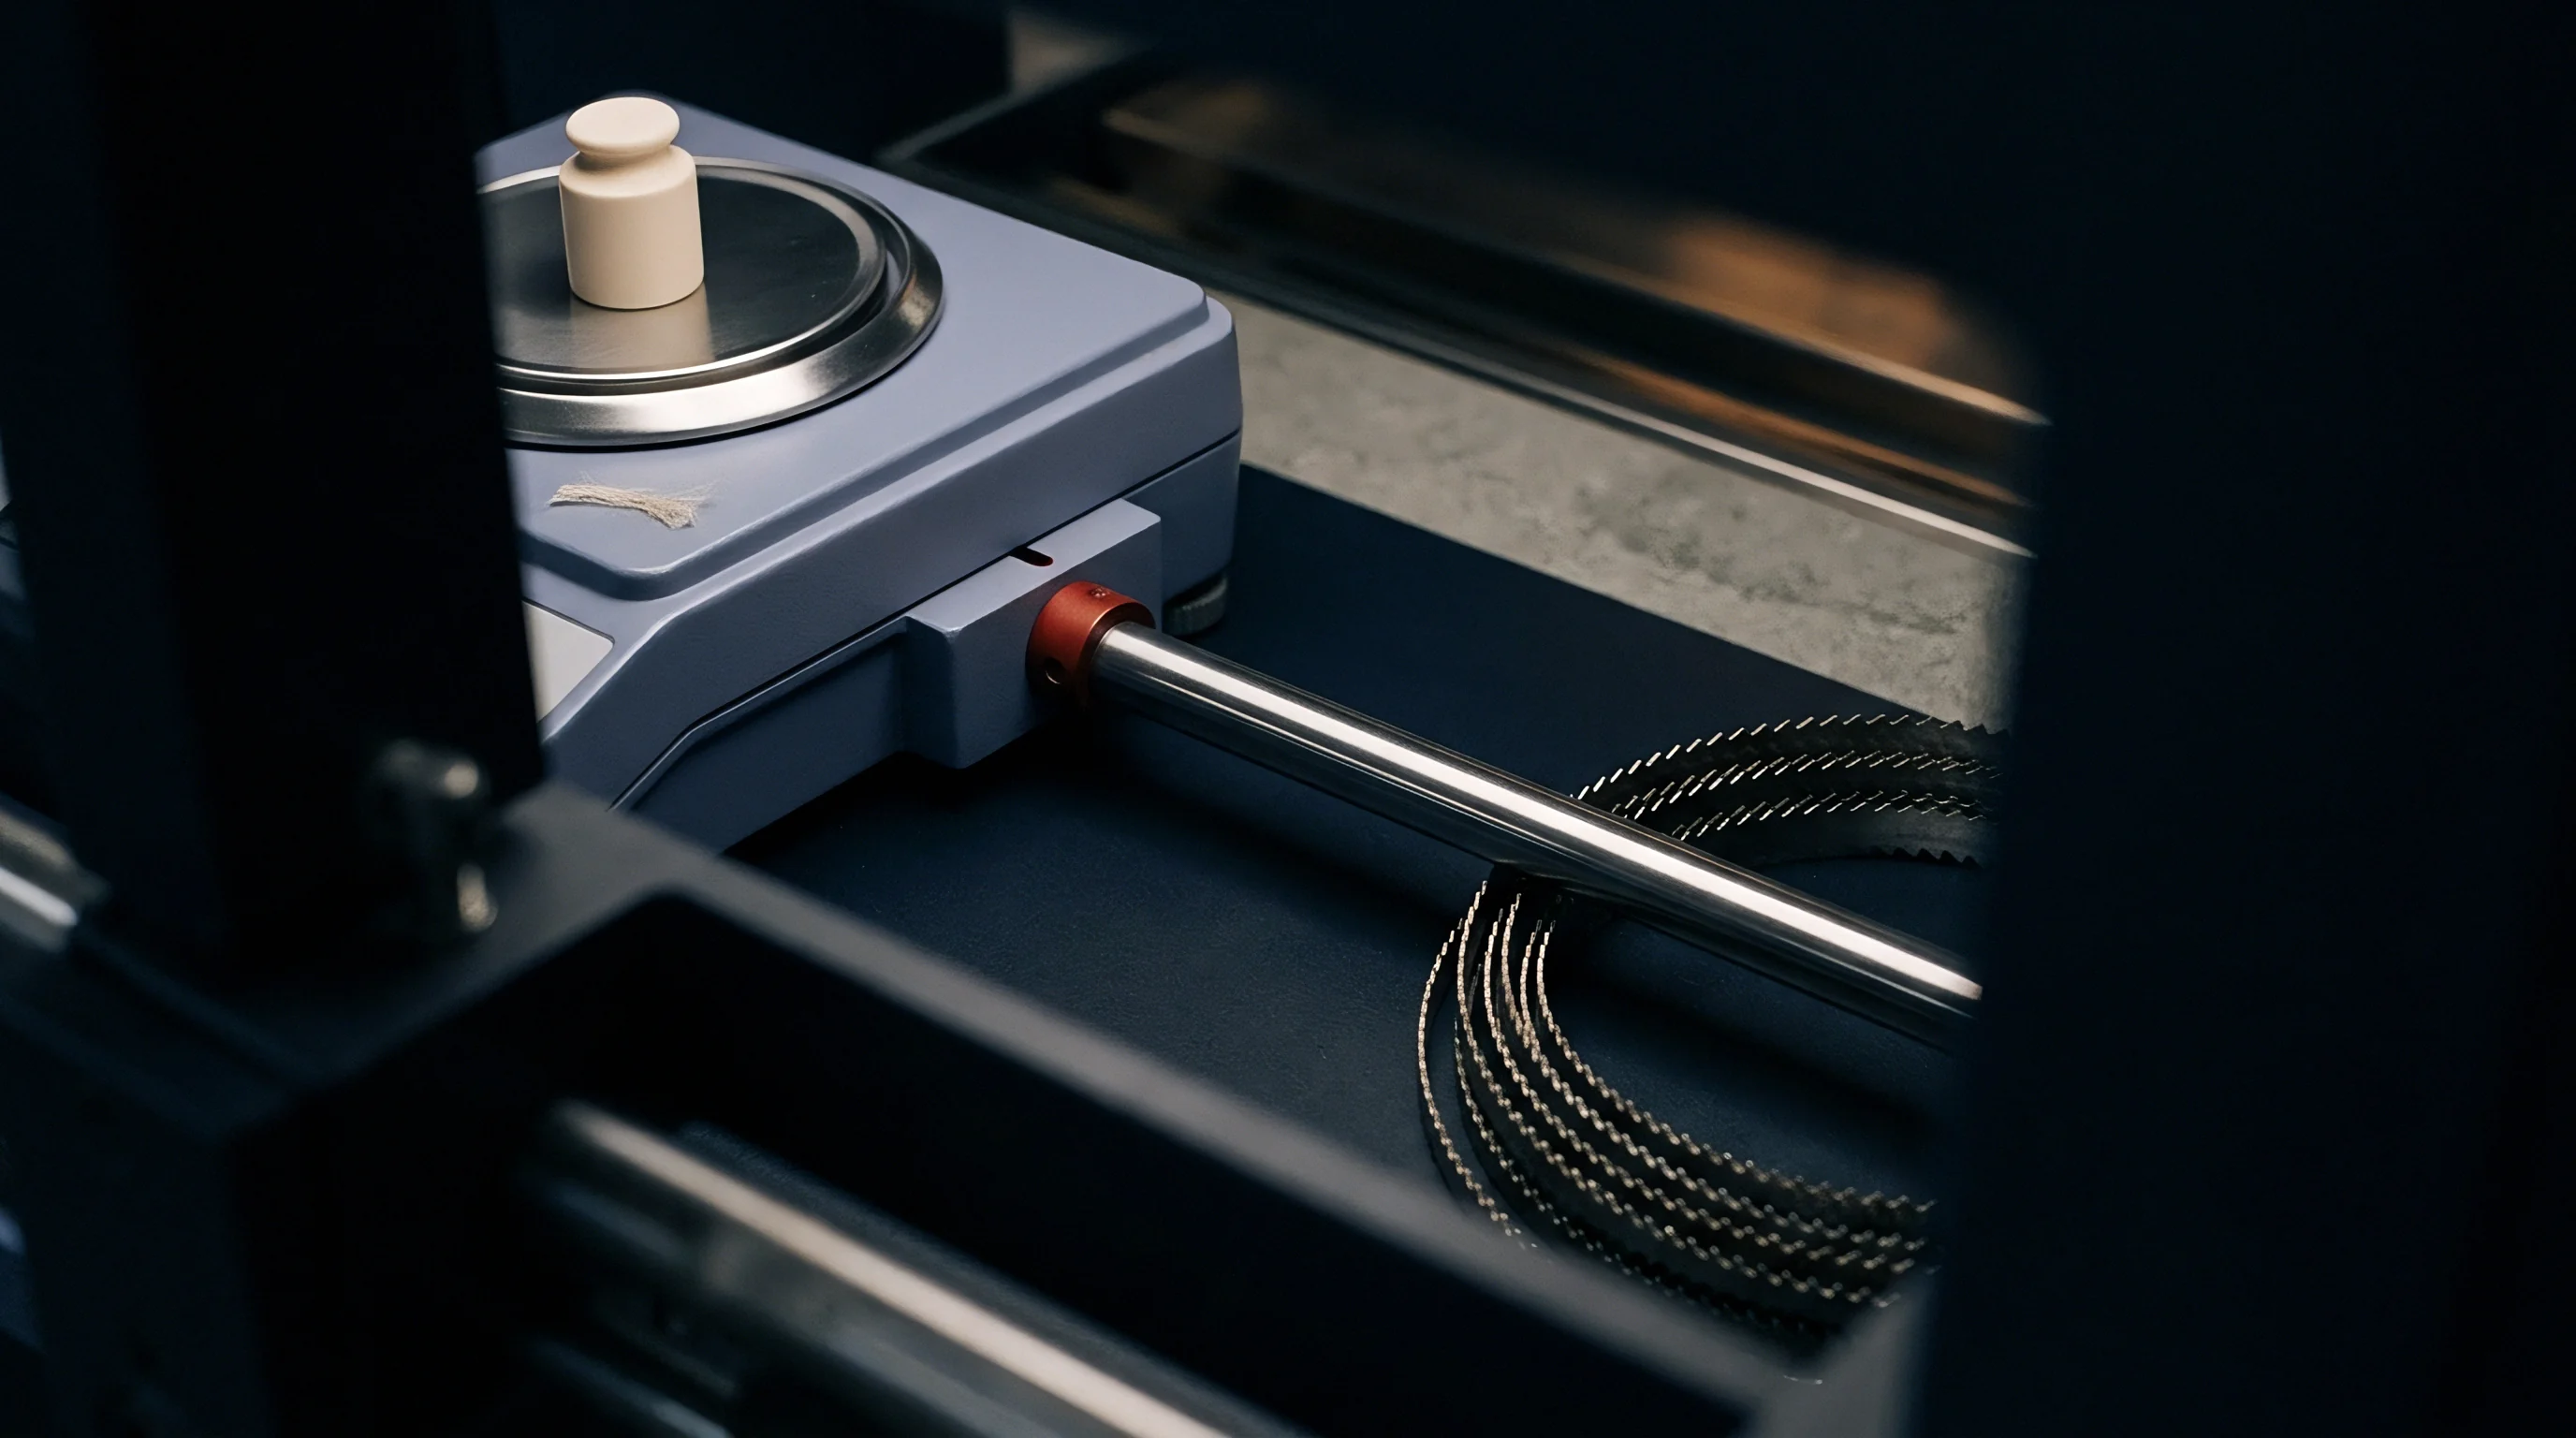
Testing long flax gravimetrically requires cutting parallel bundle samples to exact lengths with a dual-blade precision guillotine or microtome comb. Standard sample lengths range from 10 millimetres for short elementary fibre work up to 50 or 100 millimetres for technical line flax bundles. An operator selects between 100 and 500 technical strands, aligning them manually under light tension to pull out crimp without stretching the fibres.
The bundle is clamped, trimmed clean at both cut boundaries, and weighed on an analytical micro-balance accurate to 0.001 milligrams. Linear density in tex (grams per 1,000 metres) or decitex (grams per 10,000 metres) is then calculated by dividing total conditioned mass by total strand length.

Direct Cut-and-Weigh Laboratory Workflow
Accurate results depend on clean cut lengths and balance precision. Technicians use fine forceps under illuminated magnifiers to hand-select technical strands, checking each one for stray elementary fibres that would add uncounted mass without contributing to length. A valid lot test requires at least ten separate bundle weighings taken from different parts of the bale to establish a reliable mean and coefficient of variation.
Calculating linear density is a straightforward mass-to-length ratio. For a bundle of n cut strands, each L metres long, with a total measured mass of m milligrams, linear density Tt in tex is given by:
Tt = fracmn × L
For a 10-millimetre (0.01-metre) sample containing 200 strands, the total strand length equals 2.0 metres. If the micro-balance reads 4.20 milligrams, the resulting linear density is 2.10 tex. Translating tex into traditional count nomenclature allows spinners to project spinning limits directly.
Metric yarn count (Nm) ~ the metres of yarn per gram of fibre ~ equals 1,000 divided by tex. An average bundle density of 2.10 tex gives a raw fibre metric count of Nm 476. Because yarn needs multiple fibres in its cross-section to stay together under tension, practical spinnable yarn counts run at a fraction of this raw metric figure.
- Pull a representative 50-gram composite sample from five layers of the unbaled flax lot, taking care not to flex or damage individual filaments.
- Condition the sample at 20°C ± 2°C and 65% ± 4% relative humidity for at least 24 hours to reach mass equilibrium.
- Lay 200 technical strands side by side on a velvet board using fine forceps, keeping them straight and parallel without stretching.
- Secure the bundle in a dual-blade cutter set to 20.0 millimetres, dropping the blade assembly in one swift stroke to trim both ends cleanly.
- Transfer the cut bundle to an analytical micro-balance with anti-static forceps and record the stabilized mass to 0.001 milligrams.
- Calculate mean linear density in tex and determine the coefficient of variation across ten replicates to evaluate lot uniformity.
A high-speed wet-spinning mill in Heilongjiang experienced sudden end-breakage spikes on its Nm 60 line. The supplier’s certificate showed a median bundle fineness of 1.85 tex, but gravimetric verification revealed a bi-modal distribution: forty percent of the bundles measured 1.20 tex, while sixty percent came in at 2.90 tex. Although the average matched the declared 1.85 tex, a 38.5% coefficient of variation meant the coarse bundle fraction consistently jammed the wet-spinning draft rolls.
Reporting a single average without showing the distribution masks serious production risks.

Calculating Spinnable Count Limits from Bundle Linear Density
Technical bundle tex sets the limit on how far roving can draft on a wet-spinning frame. In wet spinning, roving passes through a hot water bath between 60 degrees Celsius and 80 degrees Celsius, which softens intercellular pectins so bundles can slide apart into finer sub-bundles and elementary cells. Holding a yarn together during twisting requires at least 25 to 35 fibres in the cross-section for high-quality line flax; for lower-grade dry-spun yarn, that minimum rises to 45 or 50 fibres.
To estimate the finest spinnable count from a gravimetric test, multiply the mean bundle tex by the minimum cross-sectional fibre requirement. For example, if a post-hackling line flax bundle tests at 0.45 tex and the yarn specification requires 30 fibres per cross-section, the limit is calculated as:
Ttyarn = 0.45 tex × 30 = 13.5 tex
Converting 13.5 tex to metric yarn count gives Nm 74 (1,000 / 13.5). In traditional English lea count (NeL) ~ where one lea equals 300 yards per pound ~ dividing metric count by 1.693 gives NeL 43.7. Pushing this stock to Nm 90 (11.1 tex) leaves only 24 fibres in the cross-section, dropping below the minimum structural threshold and triggering severe end breaks across the frame.
| Hackled Bundle Linear Density (tex) | Sub-Bundle Count per Tex | Cross-Sectional Fibre Requirement | Finest Spinnable Tex (g/km) | Finest Metric Count (Nm) | Finest English Lea Count (Ne_L) |
|---|---|---|---|---|---|
| 0.25 | 4,000 | 28 Fibres | 7.0 tex | Nm 142.8 | 84.3 Lea |
| 0.35 | 2,857 | 28 Fibres | 9.8 tex | Nm 102.0 | 60.2 Lea |
| 0.50 | 2,000 | 30 Fibres | 15.0 tex | Nm 66.6 | 39.3 Lea |
| 0.75 | 1,333 | 32 Fibres | 24.0 tex | Nm 41.6 | 24.6 Lea |
| 1.10 | 909 | 35 Fibres | 38.5 tex | Nm 25.9 | 15.3 Lea |
| 1.60 | 625 | 40 Fibres | 64.0 tex | Nm 15.6 | 9.2 Lea |
The direct link between cut length, mass, and spinning limits is why gravimetric testing remains essential. Micro-balances should be checked daily against certified Class S weights. A balance drifting by just 0.005 milligrams on a 20-millimetre bundle introduces a 0.25 tex error, shifting estimated spinning limits by several count numbers.
On high-value long-staple flax, gravimetric testing gives the final ground truth for both commercial pricing and technical performance.
Standard ISO 2370 compliance mandates a pre-conditioning period of 24 hours at 20°C and 65% relative humidity to prevent density underestimation.
Quality managers use direct cut-and-weigh testing as the baseline when tuning optical systems. As a practical rule, if the standard deviation in a gravimetric sample exceeds half the mean bundle linear density, no amount of hot-water soaking or chemical softening will deliver even yarn on fine-count frames.


Optics
Automated image analysis captures cross-sectional measurements across thousands of individual filaments in minutes. Optical systems like the Optical Fibre Diameter Analyser (OFDA2000 and OFDA4000) and digital microtome cross-sectional tools measure fibre width and area on microscope slides or through scanning beams. Though originally developed for round animal fibres like wool and mohair, current image processing algorithms handle the complex, non-circular shapes of bast fibres well.
These systems generate complete distribution curves, giving mean diameter, standard deviation, coefficient of variation, and curvature metrics.
Optical devices work by taking high-contrast images of short snippets (usually 0.8 to 2.0 millimetres long) spread on a dry slide or suspended in refractive index fluid. The instrument scans thousands of snippet projections, picking out fibre borders and measuring width across each filament. Sampling over 10,000 measurements per run eliminates operator bias and catches thin coarse-fibre tails that manual methods overlook.
Why Does Bundle Splitting Distort Optical Diameter Readings?
Elementary filaments often split apart during sample preparation, altering the particle population being measured. Raw scutched flax consists of technical bundles containing 5 to 40 elementary cells bound by pectin. High-shear preparation ~ like mechanical snippet chopping or ultrasonic dispersion ~ breaks these weak pectin bonds, splitting large bundles into sub-bundles or single elementary cells.
The optical analyzer then measures these separated filaments rather than the intact bundles that go through carding and hackling.
This splitting causes a consistent gap between optical diameter readings and gravimetric bundle density. An analyzer might report a fine mean diameter of 16.5 micrometres on chopped snippets, suggesting top-tier spinning performance. But if the mill’s hackling lines are running intact bundles that are 60 to 80 micrometres wide, actual processing behavior will reflect the large bundles, not the separated snippets.
Technologists have to know whether sample preparation preserved bundle structure or broke the fibre down into individual cells.
| Processing Stage | Optical Mean Diameter (μm) | Optical CV of Diameter (%) | Ellipticity Aspect Ratio | Gravimetric Linear Density (tex) | Calculated Shape Factor (k) |
|---|---|---|---|---|---|
| Raw Scutched Line Flax | 68.4 | 42.5 | 2.15 | 4.85 | 1.28 |
| Hackled Line Sliver (Pass 1) | 52.1 | 36.8 | 1.85 | 3.10 | 1.22 |
| Combed Line Roving (Pass 3) | 31.4 | 28.2 | 1.55 | 1.45 | 1.15 |
| Enzyme-Softened Roving | 22.8 | 22.4 | 1.38 | 0.68 | 1.08 |
| Ultrasonically Separated Snippets | 15.2 | 16.1 | 1.22 | 0.22 | 1.02 |
Cross-Sectional Non-Circularity and Shape Factor Corrections
Flax fibres have irregular polygonal cross-sections rather than round profiles. A two-dimensional optical reading captures the fibre from a random angle: if a ribbon-like bundle passes through the beam broadside, it looks wide; if it turns edge-on, it looks narrow. To reconcile 2D optical widths with 3D mass and gravimetric linear density, algorithms apply a shape factor correction coefficient (k) alongside an ellipticity aspect ratio.
Converting optical mean diameter (dopt in micrometres) to equivalent linear density (Ttopt in tex) uses fibre density (ρ, taken as 1.50 grams per cubic centimetre for dry flax cellulose) and the shape factor k:
Ttopt = k × fracπ4 × left(fracdopt1000right)2 × ρ × 105
For smooth, perfectly round filaments, k equals 1.0. For technical flax bundles ~ with their polygonal shapes, cell cavities, and internal lumens ~ k ranges from 1.15 to 1.35 depending on retting and compaction. Ignoring shape factors understates linear density by up to twenty-five percent, leading to wrong draft settings on the spinning floor.
Digital microtomy gives direct cross-sectional measurement without relying on 2D projections. Bundles are set in fast-curing acrylic resin, sliced into 5 to 8 micrometre sections, and imaged under a microscope at up to 400x. Analysis software traces the outer perimeter and internal lumen boundaries to calculate total cross-sectional area (μm2) and lumen void percentage.
Subtracting lumen void area from total area leaves net solid cellulose, giving an accurate foundation for mass-per-length calculations.
Coarser elementary fibres restrict the minimum spinnable limit long before wet-spinning bath temperatures can soften middle lamella pectins.
Even with modern image processing and 3D shape modelling, cross-sectional microtomy leaves one practical issue open: how reliably can software tell a real void inside a bundle from a gap introduced while mounting the slide?
Deviation
Moisture shifts and non-cellulosic impurities constantly change the apparent mass of raw flax. Bast fibres are strongly hygroscopic, absorbing and desorbing moisture as surrounding humidity and temperature move. Since linear density is mass divided by length, uncorrected moisture skews tex readings.
Raw flax also carries non-cellulosic material ~ pectins, hemicelluloses, lignin, waxes, and woody shive ~ that adds mass without offering load-bearing strength, distorting both gravimetric density and airflow readings.
Standardized conditioning protocols or immediate dry-weight testing are necessary to correct for moisture. Under ISO 6741, commercial mass and linear density are adjusted to a standard regain allowance of 12.0 percent for scutched flax line and tow. Weighing an unconditioned sample at an ambient room humidity that creates 15.5 percent moisture content makes the raw mass 3.12 percent heavier than standard commercial weight.
Without moisture correction, testing reports a coarser linear density than the fibre really has, unfairly downgrading the lot.
Hygroscopic Regain and Moisture Mass Multipliers
Cellulose and hemicellulose can absorb water vapor up to twenty percent of their dry weight as moisture binds to hydroxyl sites in the amorphous cell wall. This water causes the fibre to swell transversely, increasing cross-sectional area and bundle mass. The relationship between dry mass (mdry), conditioned mass at standard regain (mstd), and raw mass (mraw) at actual regain (Ract) follows the standard formula:
mstd = mraw × frac100 + Rstd100 + Ract
Where Rstd is the standard regain allowance (12.0% for flax). If a lab weighs a 100-metre bundle sample at 250.0 milligrams with an actual regain of 8.5%, corrected mass at 12.0% regain works out to:
mstd = 250.0 mg × frac112.0108.5 = 258.06 mg
Uncorrected density at 8.5% regain reads as 2.50 tex, but standard corrected density is 2.58 tex. Across multi-ton shipments, a 3.2% gap in linear density alters yarn yield estimates by several metric counts, directly shifting mill margin calculations.

Retting Severity and Non-Cellulosic Impurity Allowance
Residual pectins add mass without contributing load-bearing length. The degree of retting dictates the ratio of alpha-cellulose to binding compounds: under-retted flax carries high levels of insoluble pectins and waxes that lock fibres into coarse bundles, while over-retted stock suffers enzymatic damage that weakens cell walls and reduces filament density. Boiling samples in 1.0% sodium hydroxide (NaOH) for 60 minutes strips away non-cellulosic matter, letting analysts isolate pure cellulosic linear density.
| Flax Origin & Retting Method | Raw Regain (Ract %) | Regain Multiplier (Km) | Boil-off Extraction Loss (%) | Residual Shive Content (%) | Net Cellulosic Density (tex) |
|---|---|---|---|---|---|
| Normandy Dew-Retted Line (Optimal Retted) | 11.5% | 1.0045 | 8.2% | 0.4% | 1.82 tex |
| Flanders Dew-Retted Line (Under-Retted) | 9.8% | 1.0200 | 14.5% | 1.2% | 2.15 tex |
| Heilongjiang Dew-Retted Tow (Coarse Stock) | 8.2% | 1.0351 | 18.8% | 3.8% | 3.45 tex |
| Water-Retted European Line (Historical Standard) | 12.2% | 0.9982 | 6.5% | 0.2% | 1.45 tex |
| Enzyme-Retted Green Flax (Unscutched) | 14.1% | 0.9816 | 22.4% | 5.5% | 4.10 tex |
Evaluating raw shipments requires measuring non-cellulosic mass loss. Table 4 shows that under-retted or green flax can lose up to 22.4 percent of its mass during chemical extraction. When testing green flax, raw gravimetric tex reflects unremoved pectin rather than true fibre density.
In hot-water troughs or alkaline baths, these pectins dissolve, causing yarn to lose up to twenty percent of its mass. If spinning calculations relied on raw fibre weight, the finished yarn comes out significantly lighter than planned, leading to weight-per-metre failures in the woven fabric.
- Hygroscopic Hysteresis Control requires conditioning samples along an adsorption path rather than a desorption path to avoid a 0.8 percent regain discrepancy.
- Solvent Extraction Protocol specifies Soxhlet extraction with petroleum ether to strip surface waxes before cut-and-weigh testing on unretted stock.
- Shive Mass Deduction requires manually picking out and subtracting woody core particles over 0.5 millimetres before calculating bundle tex.
- Ash Content Verification uses muffle furnace incineration at 575°C to measure mineral dust contamination that inflates sample weight.
Testing done without solvent extraction overcounts bundle mass by including insoluble surface lipids.
Relying on unconditioned airflow readings taken during high ambient humidity resulted in a costly rejection on a 20-tonne shipment of Heilongjiang dew-retted line flax. Moist air swelled the fibres and raised airflow resistance, mimicking fine-grade stock. When conditioned samples were retested, measured linear density shifted from an apparent 1.95 tex to an actual 2.45 tex ~ failing contract specifications for Nm 50 wet spinning and forcing a renegotiation at a fifteen percent discount.


Contract
Commercial pricing for raw scutched flax rests heavily on certified linear density. In international trade, price per kilogram depends on staple length, color, retting uniformity, and above all, spinnable count capacity based on bundle fineness. Stock capable of spinning to Nm 80 commands more than double the price of material limited to Nm 30.
Sales contracts include detailed lab testing requirements with defined tolerances for median linear density, coefficient of variation, and maximum coarse-bundle fractions. Certified testing provides an objective basis for price adjustments, waste claims, and disputes.
Using verified linear density data in procurement protects mills from excess processing waste. In a typical hackling line, scutched flax passes through pinned beds to comb out short fibres (tow), align long filaments, and split coarse bundles into finer sub-bundles. Coarser raw stock needs heavier pinning, pushing a larger portion of material into lower-value tow.
By verifying gravimetric and optical density when opening bales, technicians can adjust pin densities, draft ratios, and trough temperatures to protect yield.

Hackling Waste and Drafting Force Economics
Fibre fineness determines how much long-staple line flax is recovered versus short tow. Coarse bundles resist splitting during hackling, bending pins and pulling long fibres down into tow hoppers. If a mill buys raw scutched line flax at 4.20 Euros per kilogram expecting a 65% line flax and 35% tow yield, profitability hinges on holding that ratio.
If coarse, under-retted bundles drop the actual line yield to 52%, the effective cost of the line sliver jumps sharply, cutting directly into spinning margins.
Table 5 outlines yield dynamics, waste allowances, and finished fabric costs across five commercial grades based on certified linear density.
| Certified Bundle Linear Density | Target Spun Yarn Count | Hackling Line Yield (%) | Spinning End-Break Rate (per 1,000 Spindle Hours) | Fibre Cost per Kg Landed (€) | Finished Woven Fabric Cost (€/m at 150g/m²) |
|---|---|---|---|---|---|
| 1.35 tex (Superfine Line) | Nm 80 (12.5 tex) | 72.5% | 18 Breaks | € 7.85 / kg | € 2.45 / m |
| 1.85 tex (Fine Line) | Nm 60 (16.6 tex) | 68.0% | 24 Breaks | € 5.40 / kg | € 1.78 / m |
| 2.40 tex (Medium Line) | Nm 40 (25.0 tex) | 62.5% | 31 Breaks | € 4.10 / kg | € 1.42 / m |
| 3.50 tex (Coarse Line) | Nm 26 (38.4 tex) | 54.0% | 45 Breaks | € 3.15 / kg | € 1.18 / m |
| 5.20 tex (Heavy Tow) | Nm 14 (71.4 tex) | 42.0% (Carded) | 62 Breaks | € 2.10 / kg | € 0.92 / m |
Fibre linear density flows directly into fabric costing. A 150 g/m² fabric woven from Nm 60 yarn requires 150 grams of fibre per square metre plus loom waste. But if uncertified fibre forces a mill to spin a coarser Nm 40 yarn to avoid end breaks, fabric mass at the same pick count jumps to 225 g/m².
The mill uses fifty percent more raw material per metre, raising yarn costs while ruining target hand and drape. Verifying density at bale opening ensures raw stock fits target fabric specifications before running the mill.

Linear Density Tolerances in Commercial Delivery Specifications
Spinning contracts specify target tex values and upper limits on coefficient of variation. For legal enforcement, supply contracts set specific test protocols, sampling plans, and price adjustment formulas for off-spec shipments. Standard contracts require linear density testing to follow ISO 1973 after 24 hours of conditioning under ISO 6741, using at least ten bundle cuts per five-tonne sub-lot.
Tolerances follow strict variance bands. Delivered lots within ± 3.0 percent of target linear density are accepted at full price. If density is 3.1 to 7.0 percent coarser than spec, a penalty formula reduces invoice value by 1.5 times the percentage deviation.
If density runs more than 7.0 percent coarse, or if coefficient of variation exceeds 22.0 percent, the buyer has the right to reject the entire lot at seller expense.
Contracts must state clearly whether linear density applies to raw scutched flax, hackled sliver, or degummed fibre. A clause specifying “Flax fibre linear density shall not exceed 2.0 tex as measured by direct gravimetric cut-and-weigh under ISO 1973 after standard 24-hour conditioning, with non-conforming lots subject to a 2.0 percent invoice deduction per 0.1 tex variance above specification” removes ambiguity and protects buyers from paying for unretted mass.