Evaluating Linear Density Uniformity in Wet Spun Flax Sliver Lots
Evaluating wet-spun flax sliver linear density requires combining ten-metre cut-and-weigh gravimetric tests with conditioned capacitance spectrogram analysis.
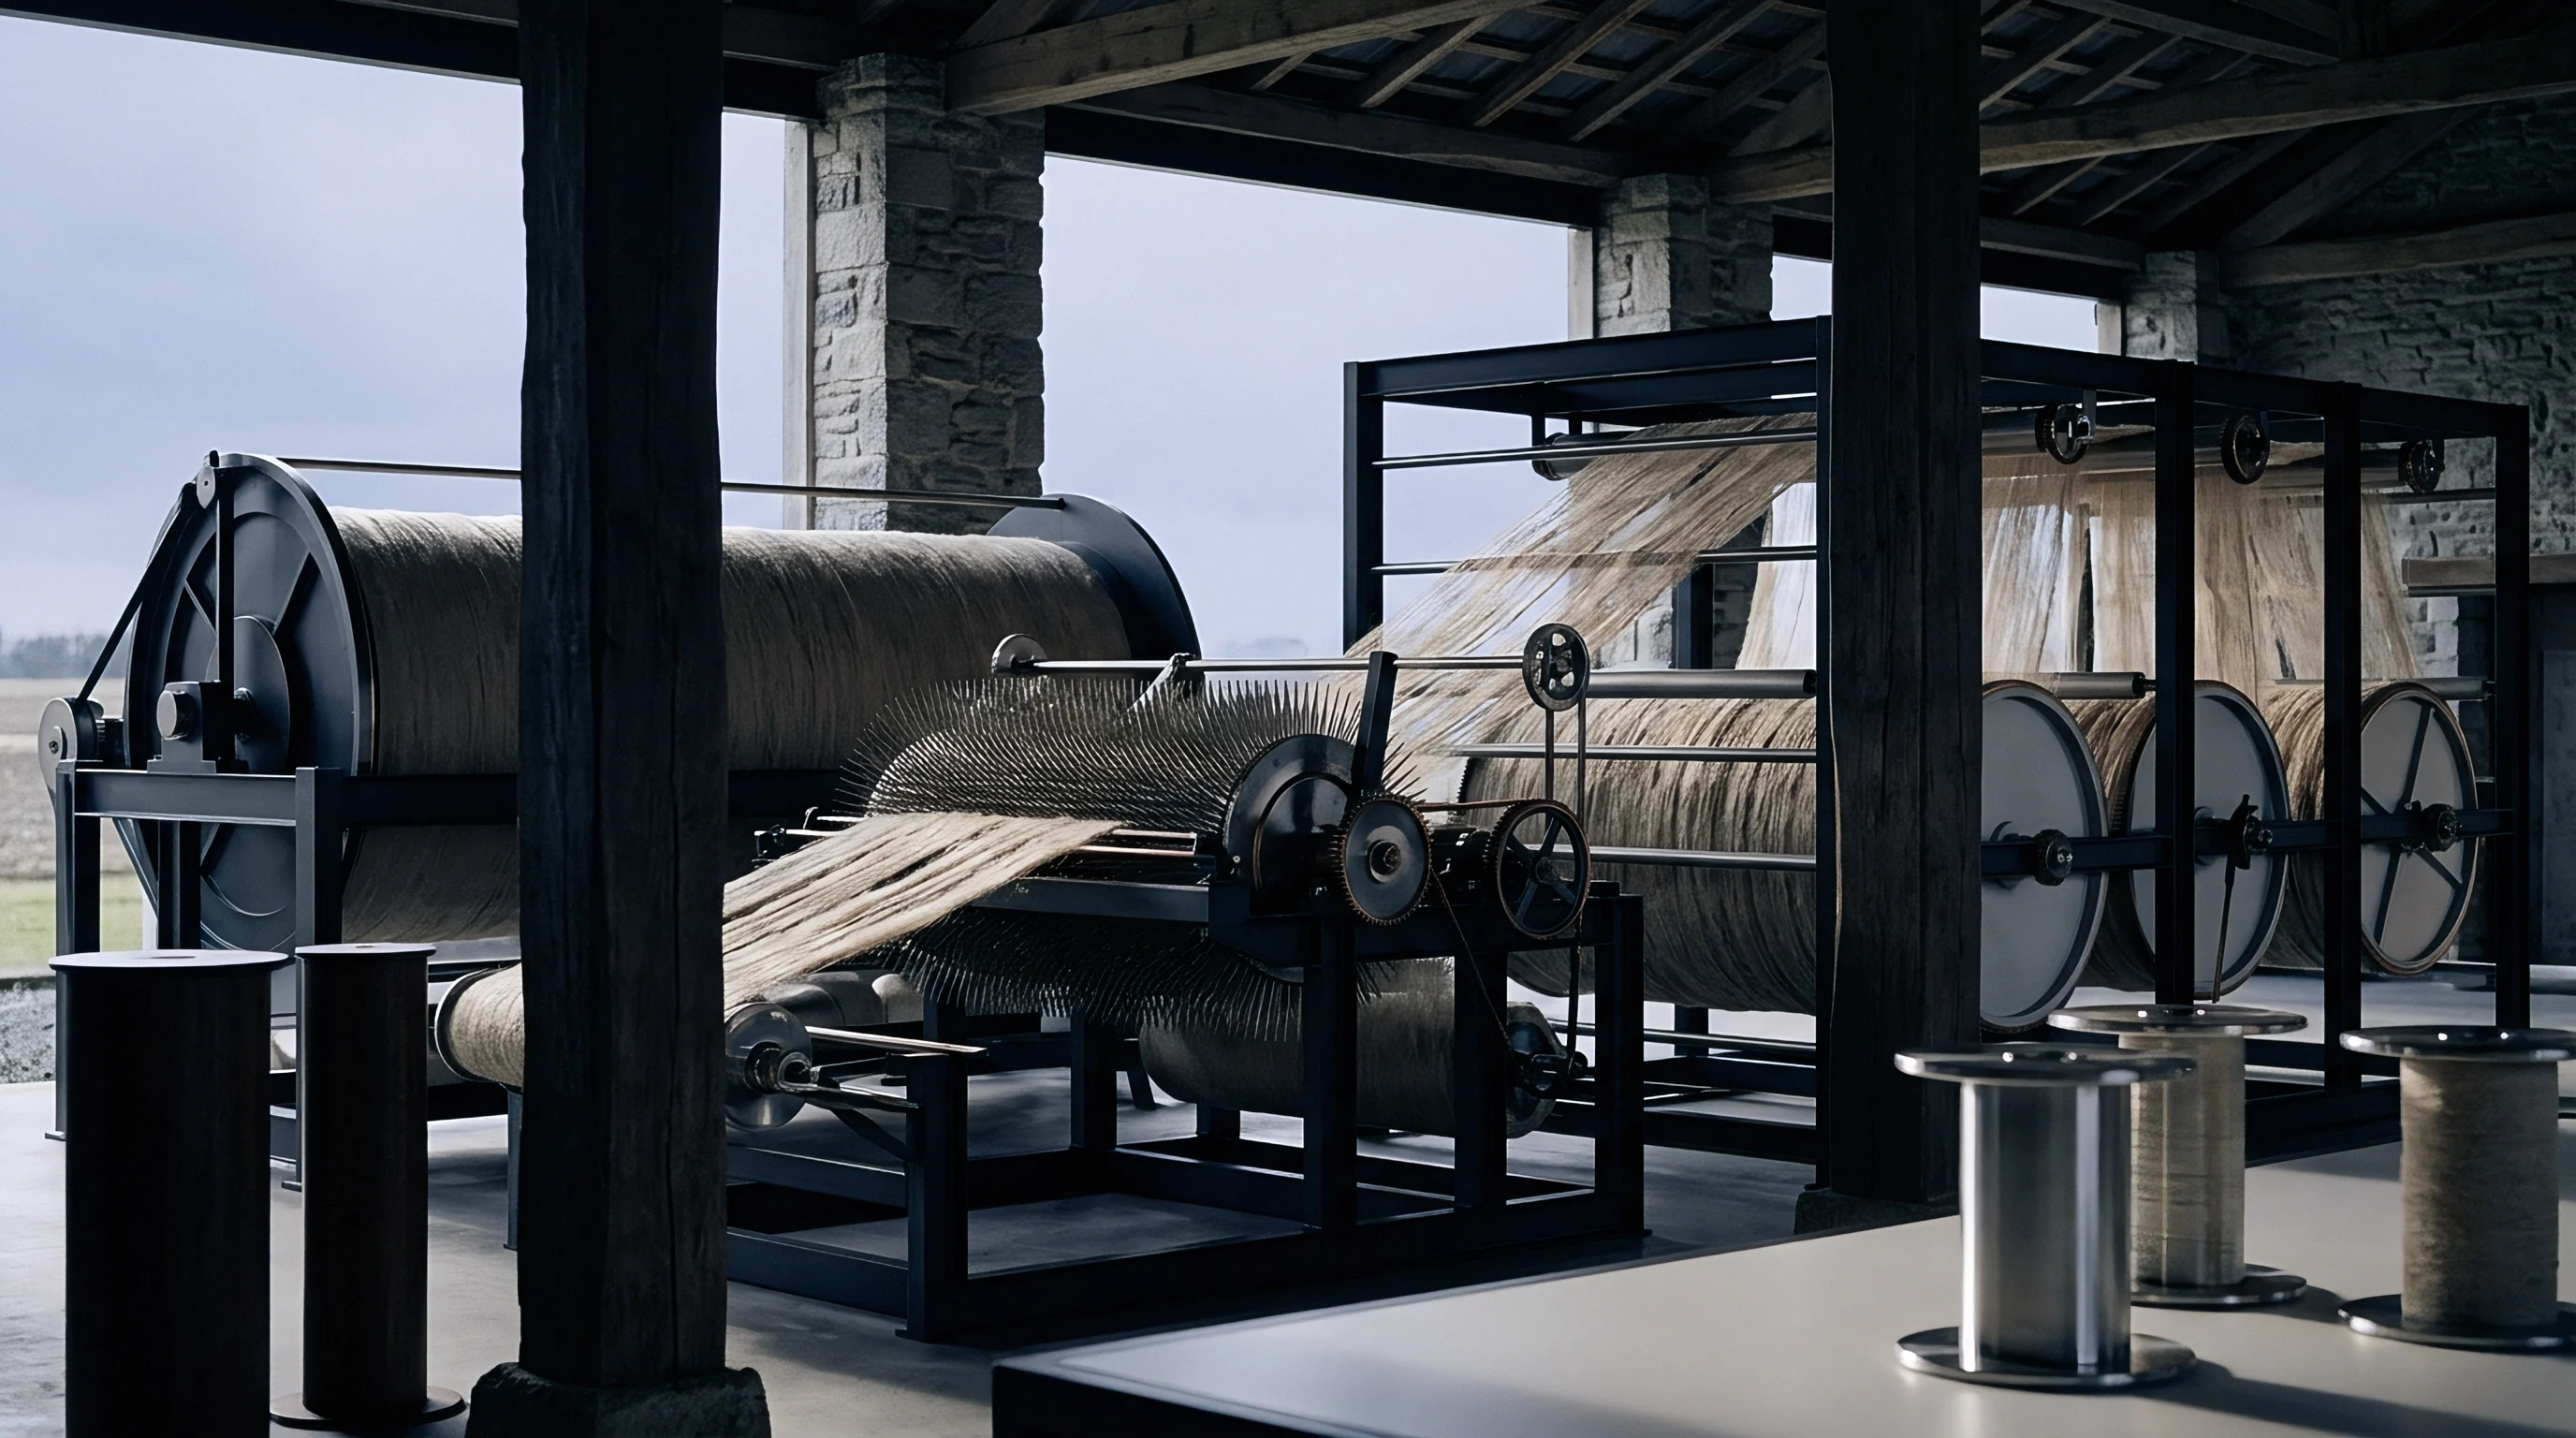
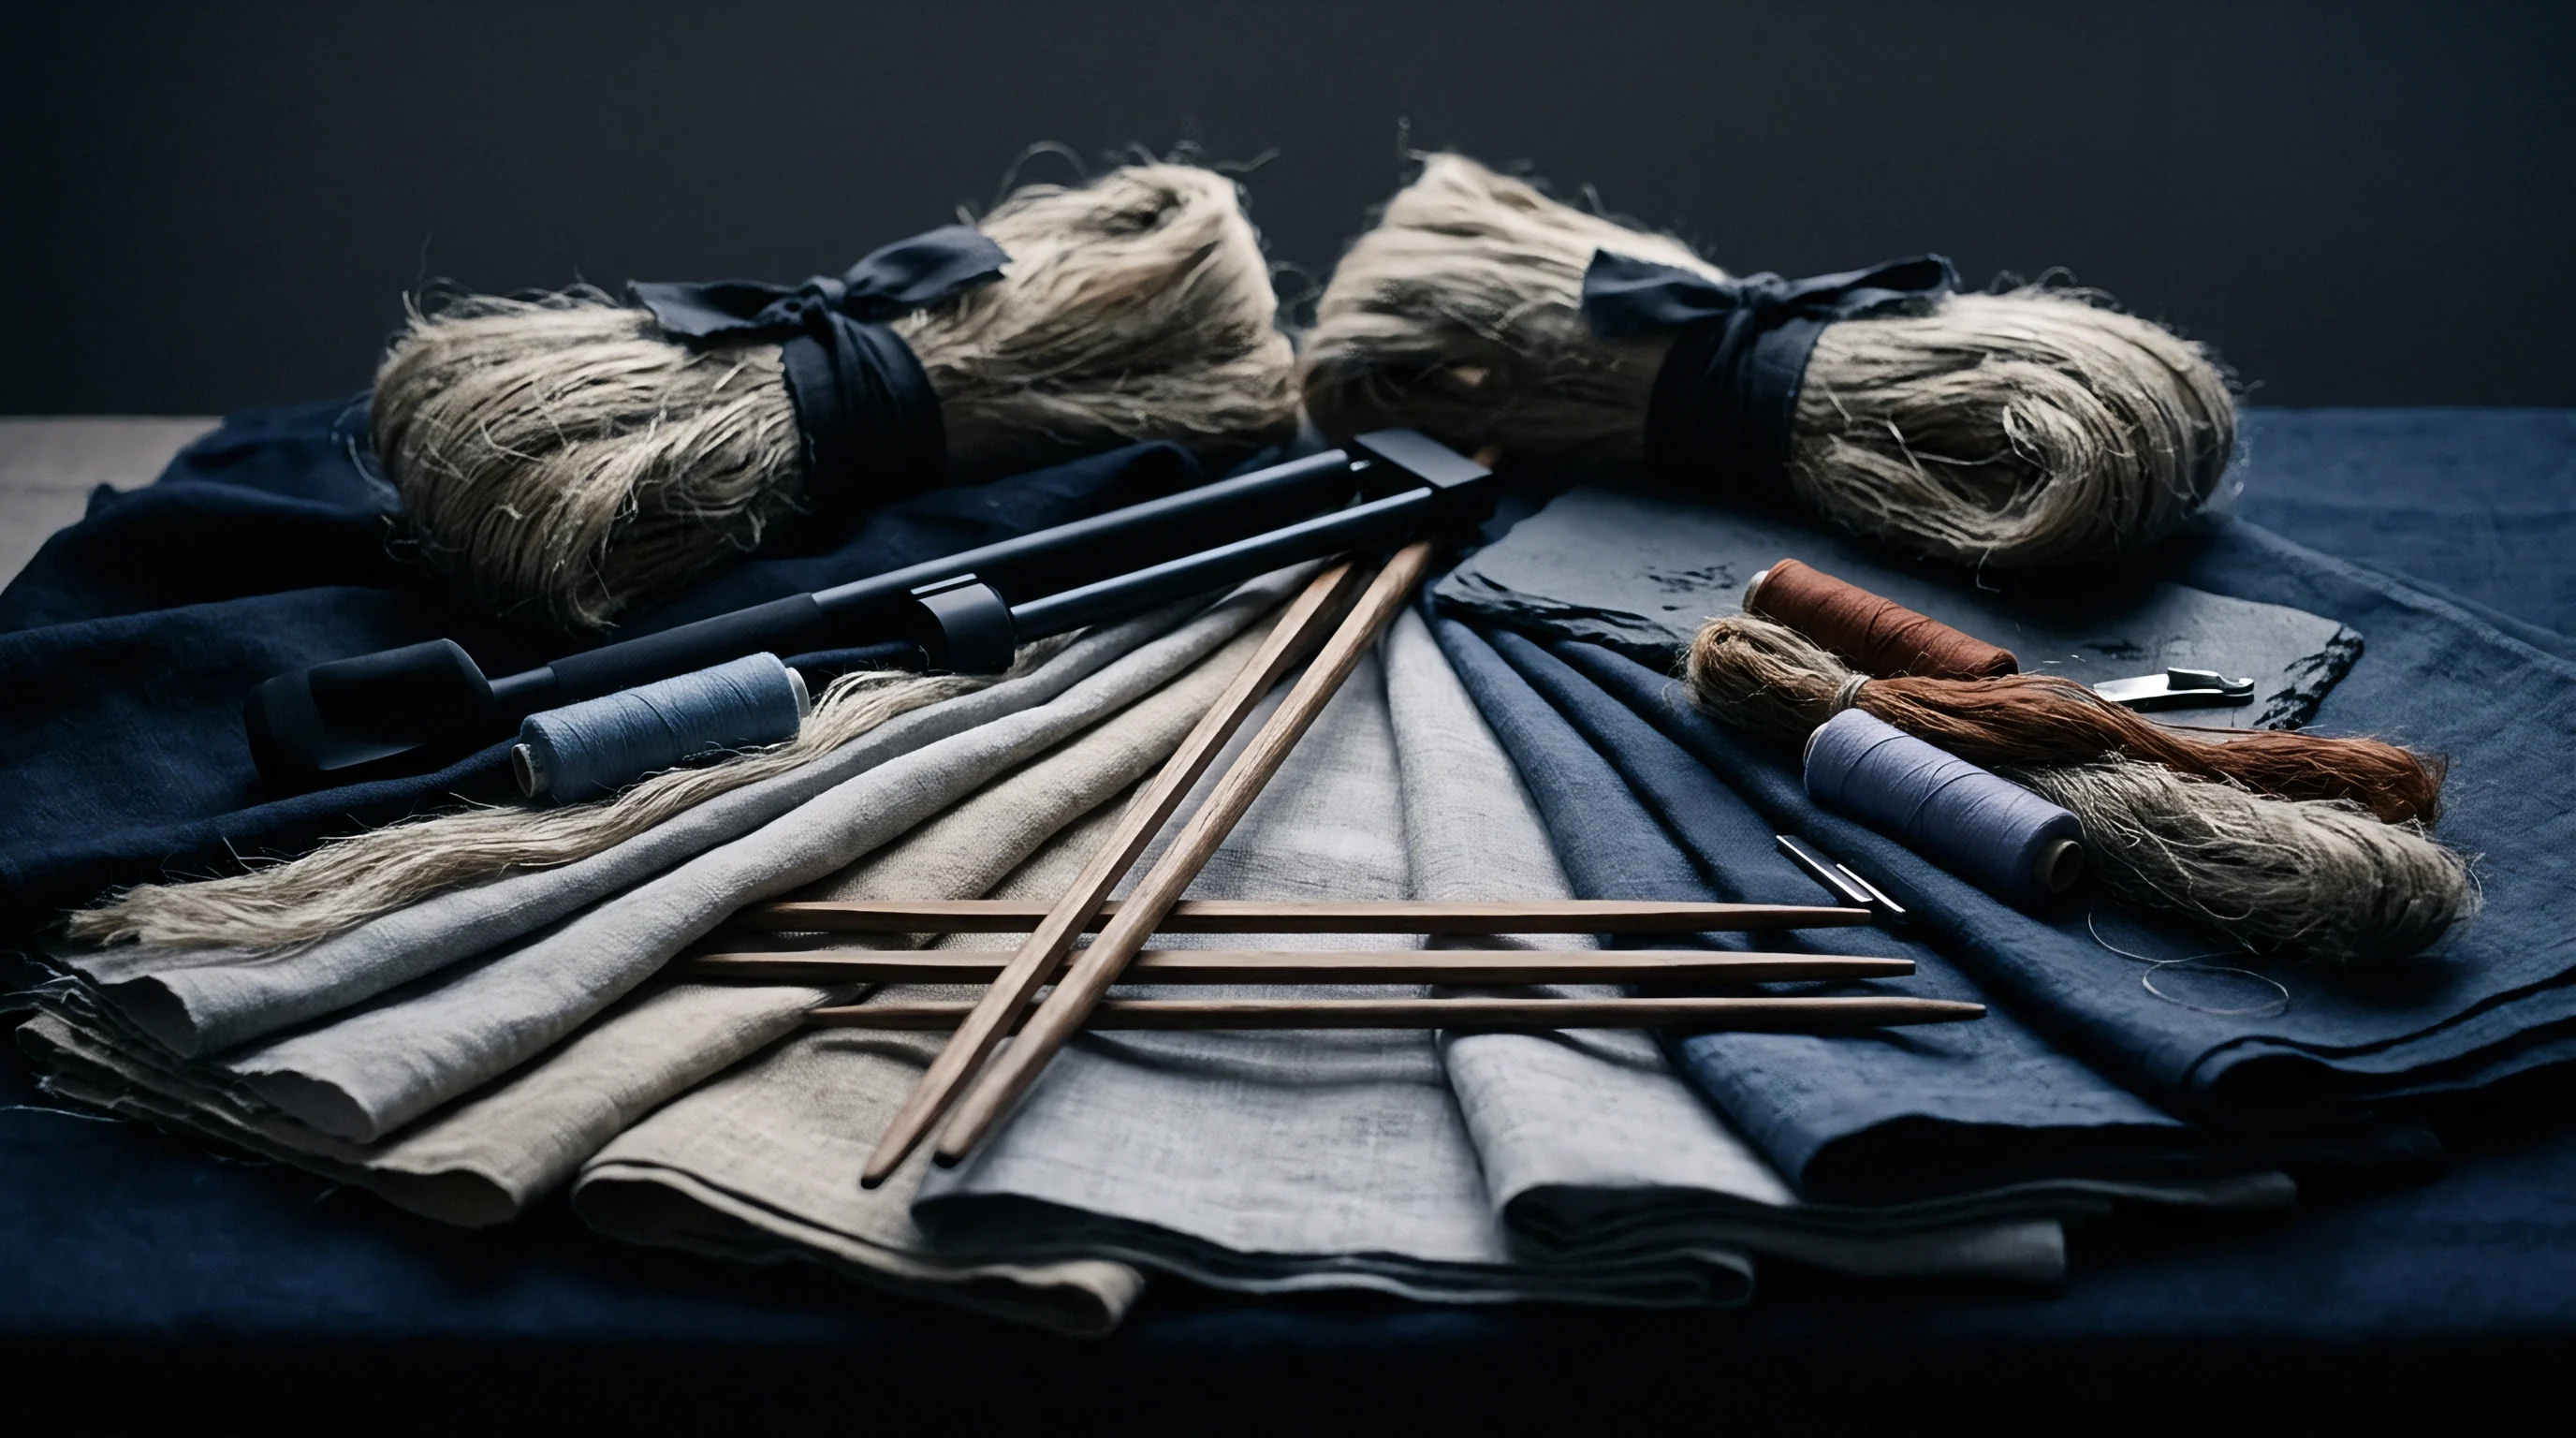
Mass
A 5.0 kilotex line flax sliver fed into a roving frame carries natural density variations inherited from the raw bast fibre bundles. Unlike synthetic continuous filaments or uniform staple cotton, flax mass per unit length depends entirely on how effectively technical bundles split during retting, scutching, and hackling. In wet spinning, where roving passes through a hot water bath just before final drafting, any mass variation in the sliver destabilizes drafting, raises end break rates, and degrades yarn count CV%.
Evaluating a lot’s mass variation requires tracking both short-term fibre grouping and long-term drift in sliver thickness.
Line flax leaves little margin for drafting error. Linear density is measured in kilotex (g/m) and typically runs from 3.0 to 6.0 kilotex for standard drawing slivers, depending on the target wet-spun lea count. Short-term mass variations over 1 cm to 10 cm stem from bundle end-distribution and variations in fibre fineness (metric fibre number, Nm).
Long-term variations over 10 metres to 100 metres reflect uneven feeding at the hackling spreader or autoleveler response limits on the draw frame.
Bast Fiber Morphology and Cohesion Mechanics
Raw scutched flax relies on intercellular pectin to bind elementary fibres into structural bundles. These elementary fibres measure 10 to 30 millimetres long and 15 to 25 micrometres wide, whereas the technical bundles they form span 500 to 900 millimetres. Each pass through hackling splits these technical bundles finer, altering the fibre count across the sliver cross-section.
Short tow fibres remain unaligned. If retting fails to divide the bundles sufficiently, dense clusters pass through the faller pins intact, creating abrupt local spikes in mass.
Without false twist introduced before roving, unspun flax sliver relies solely on surface friction and natural bundle crimp to hold together. Dew-retted stock from Western Europe exhibits higher surface friction than water-retted or enzyme-treated lots because residual waxes and micro-shive particles remain attached. This friction profile determines the draft force required at the draw frame.
When bundle fineness varies widely across a lot, drafting force fluctuates continuously, generating drafting waves that appear as periodic density defects.
A ten-metre cut-and-weigh sample taken from a third-passage draw frame sliver exhibits a coefficient of variation below two percent under standardized conditioning at sixty-five percent relative humidity.
Linear Density Variance across Hackling Line Passages
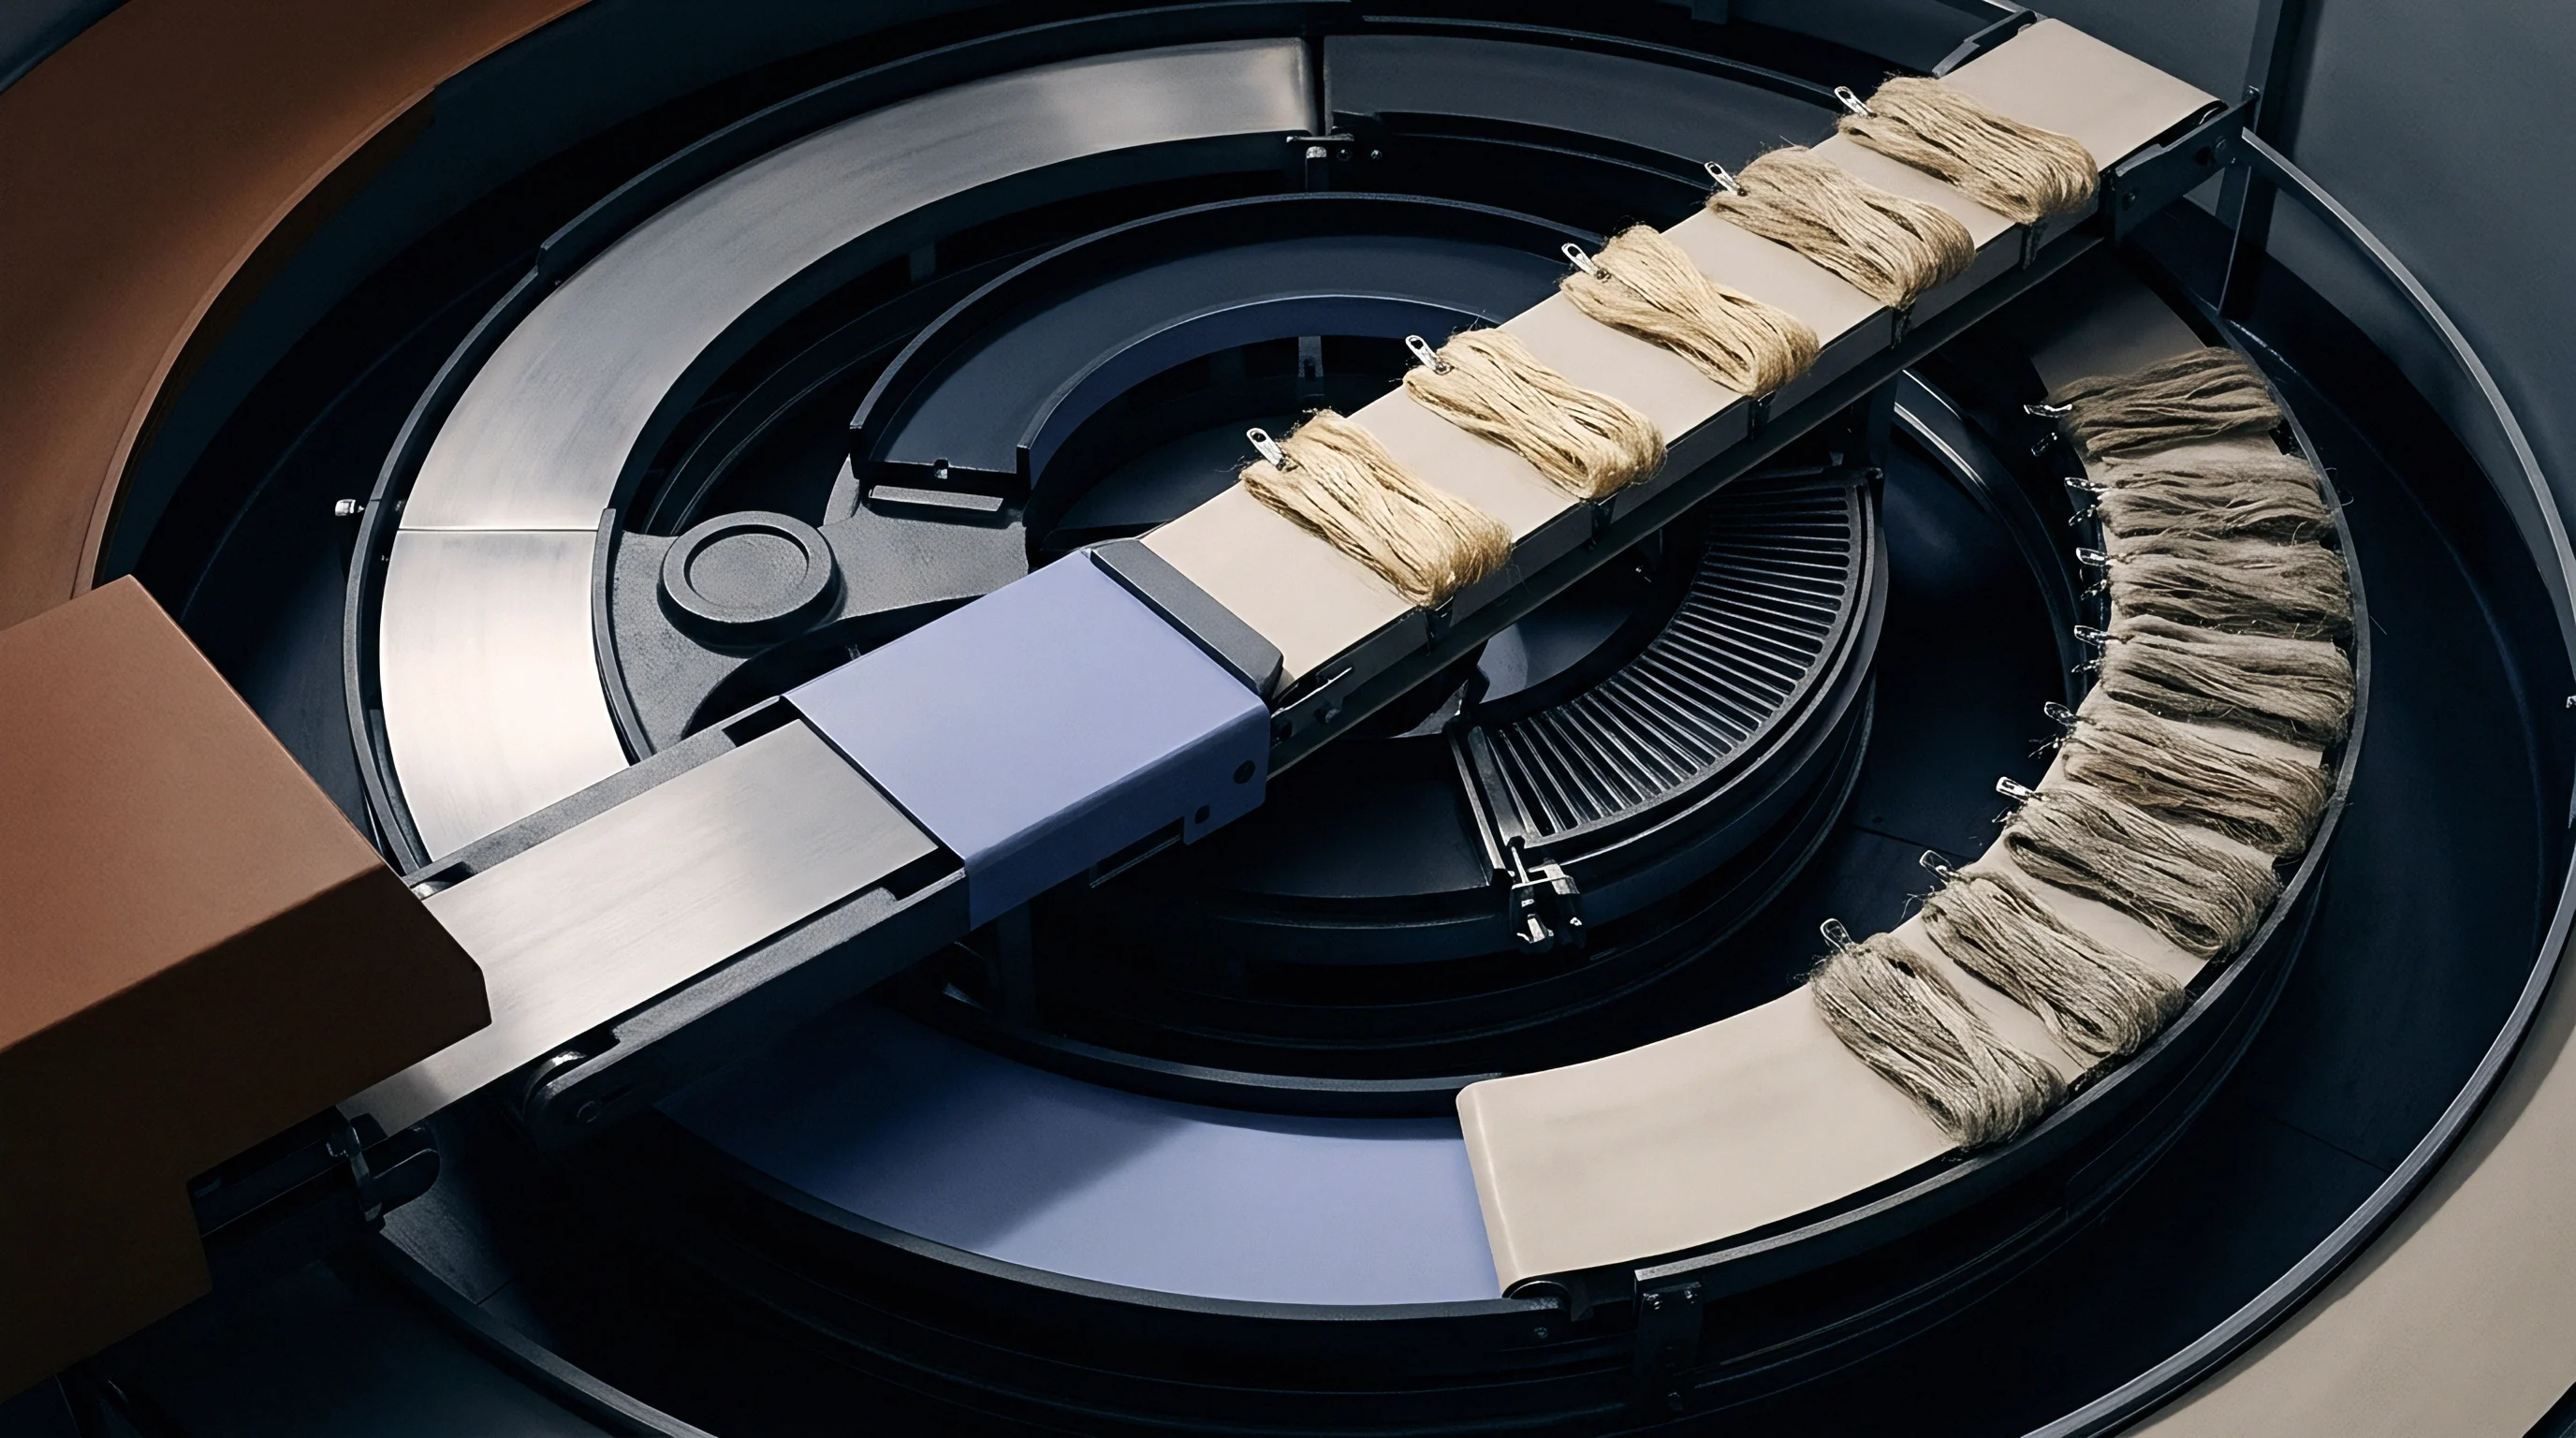
Mechanical combing during hackling aligns raw scutched strands into a parallel sliver. Spreaders deposit these bundles onto a feed apron to form the initial web structure. Any mass variation introduced at the spreader carries through the mill unless cancelled out by doublings.
Output sliver leaving the hackling line at 20 kilotex typically undergoes three or four drawing passages to reduce mass to a spinnable 3.5 to 5.0 kilotex.
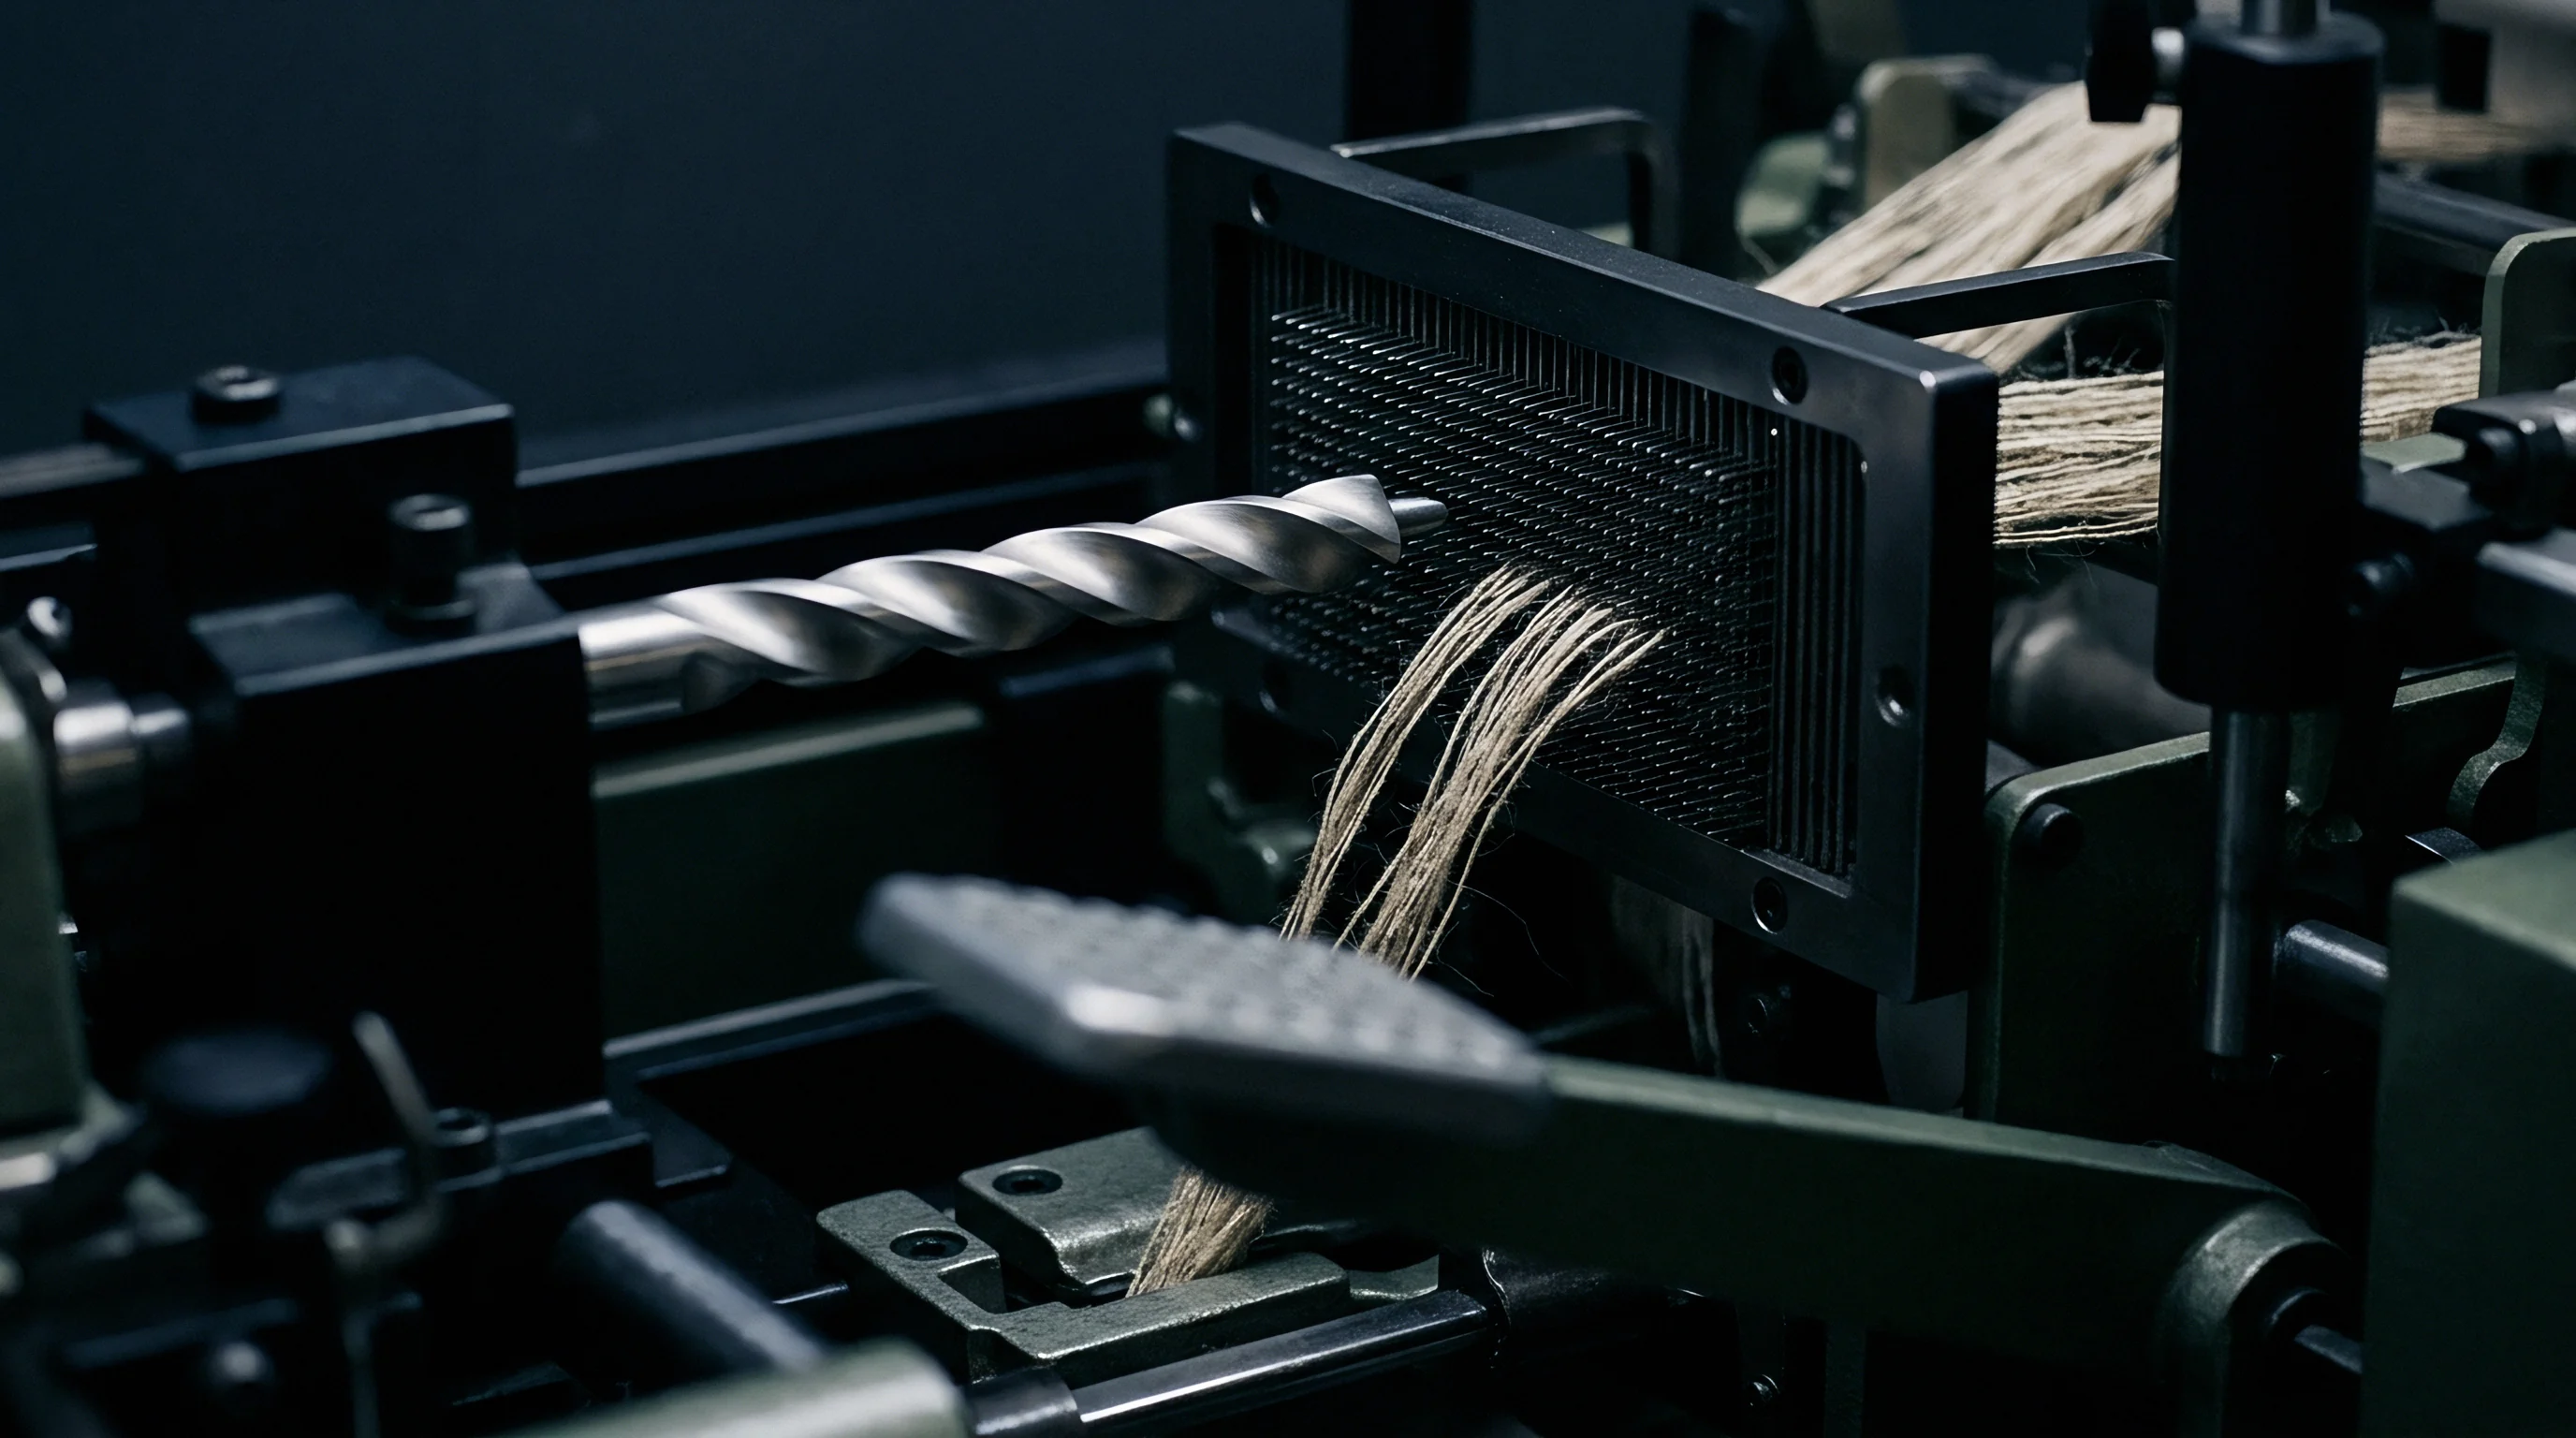
Steel-pinned faller bars guide moving fibres through the first drawing passage to control drafting. However, as pins enter the web, thick technical bundles resist penetration, displacing sliver and causing irregular draft steps. Linear density measurements at this stage show high variation, with CV% frequently exceeding 8.0 percent.
Subsequent drawing passages smooth out these fluctuations by combining four to six slivers in a single drafting zone. Evaluating incoming line flax sliver lots starts with checking the coefficient of variation across ten-metre cuts to verify whether doubling successfully suppressed spreader-induced periodicities.
If draw frame mass variations remain uncorrected, the wet-spinning frame must run higher spindle draft ratios to pull through heavy spots. Heavy sliver sections lack sufficient time to soften during their brief immersion in the sixty-degree-Celsius trough, causing raw bundle clumps to be pulled straight into the front drafting roller nip. This breaks the thread instantly, stopping the frame, losing production time, and turning roving into scrap.
Spectra
Frequency domain analysis converts continuous mass fluctuations into distinct wavelength patterns that point directly to equipment or process faults. Capacitive and optical testing instruments apply a Fourier transform to the sliver profile, plotting amplitude against wavelength on a spectrogram. On bast fibre slivers, interpreting these graphs accurately requires separating genuine structural mass variations from dielectric noise caused by uneven moisture distribution.
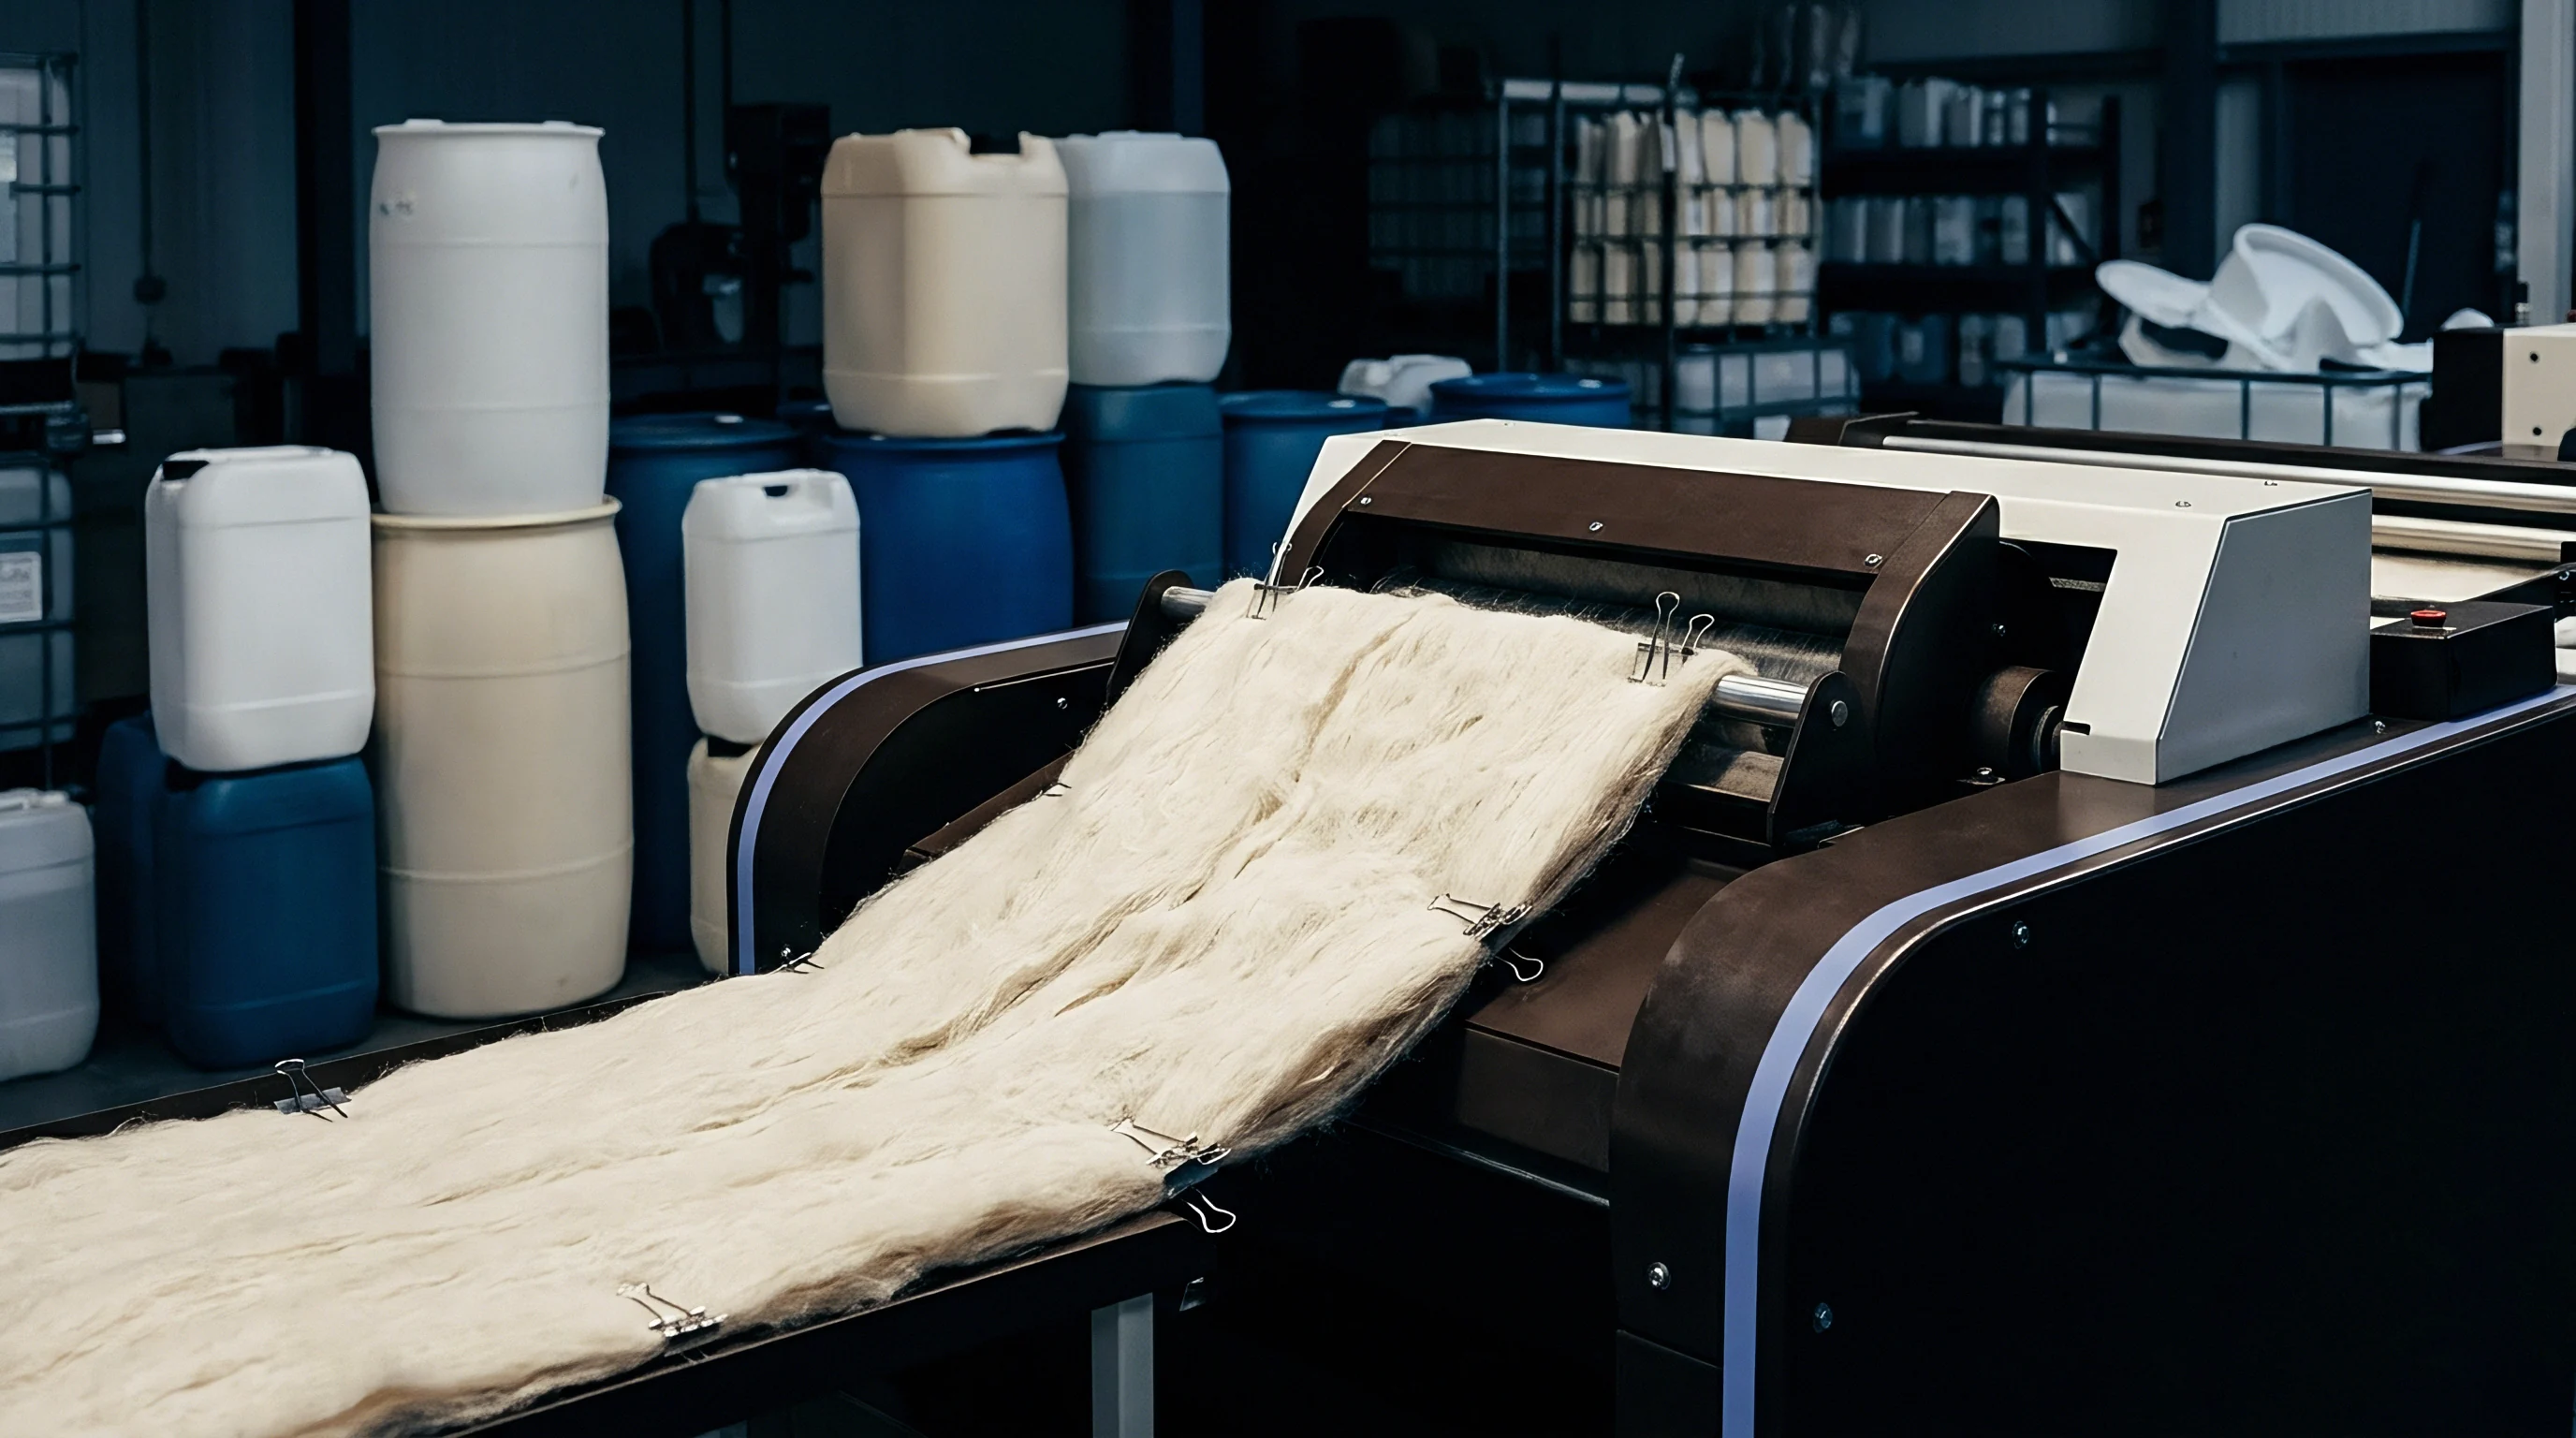
Capacitance cells measure mass by monitoring changes in electrical capacitance as the sliver moves between two parallel sensor plates. Because water has a relative dielectric constant near eighty while dry cellulose sits around three, localized moisture skews the mass reading. If a wet-spun lot sits in unconditioned room air, moisture absorbs unevenly into the outer layers of the sliver can, generating artificial mass spikes at wavelengths matching the can rotation cycle.
Capacitance Cell Response to Heterogeneous Bast Structures
Dielectric instruments register moisture variations alongside fibre mass when evaluating natural bast strands. To prevent false readings during quality checks, samples must reach moisture equilibrium under ISO 6741 standards ~ conditioned at twenty degrees Celsius and sixty-five percent relative humidity for at least twenty-four hours. Isolating moisture anomalies requires running parallel cut-and-weigh samples against capacitive Uster Tester profiles to establish accurate calibration coefficients for high-shive lots.
Optical mass systems use line-scan arrays or infrared LED barriers to gauge shadow width across the sliver cross-section rather than measuring dielectric mass. This avoids moisture interference, but optical sensors remain sensitive to cross-sectional geometry. Untwisted flax flattens into an oval profile as it passes over guide rollers; an optical sensor facing the wide side overstates linear density, while one facing the narrow edge understates it.
Reliable assessment of flax sliver uniformity requires dual-axis optical sensing or high-frequency capacitance testing cross-checked against gravimetric samples.
| Wavelength Range | Dominant Defect Mode | Root Mechanical Cause | Impact on Spun Yarn |
|---|---|---|---|
| 2 cm to 10 cm | Short-term drafting wave | Incorrect faller bar pin density or wide front-roller nip gap | Thin spots, elevated end breaks, high yarn count CV% |
| 15 cm to 50 cm | Periodic mass wave | Eccentric bottom drafting roller or damaged top roller cot | Moiré patterning in woven fabric, localized thick bars |
| 1 m to 5 m | Mid-term periodic drift | Autoleveler sensor lag or improper measuring-wheel tension | Long-length count variations, shade variation after dyeing |
| 10 m to 100 m | Long-term lot drift | Spreader apron feeding inequality at the hackling stage | Bolt-to-bolt mass variations, fabric weight non-compliance |

Identifying Drafting Waves and Mechanical Imperfections
Periodic mass shifts appear on test charts as distinct peaks at specific wavelengths. A sharp spike matching the circumference of the front drafting roller indicates mechanical runout from a bent arbor or uneven cot. A broader, rounded hump spanning two to eight centimetres signals drafting waves caused by unguided floating fibres moving through the main draft zone.
Drafting waves occur routinely in flax processing because bundle staple lengths vary widely. Technical fibres within a single sliver range from fifty millimetres to over seven hundred millimetres. Standard roller draft zones cannot grip short bundle fragments firmly while allowing long line fibres to pass unbroken.
When short fibres accumulate in the draft zone, they slip forward in erratic clusters rather than a uniform stream. This cluster movement generates periodic mass surges that degrade downstream yarn appearance.
Drawing problems typically manifest in four ways:
- Faller Pin Deflection happens when thick technical bundles bend pins backward, letting clamped fibres burst unchecked into the main draft zone and triggering high-amplitude short-wave peaks.
- Roller Cot Indentation occurs when heavy clamping pressure on polyurethane press rolls presses flat spots into dormant rollers, creating mass spikes with every rotation.
- Autoleveler Control Lag occurs when dynamic draft controls fall behind quick shifts in feed density, turning random spreader noise into amplified mid-term mass waves.
- Sliver Can Coiling Tension Strain stems from mismatched coiler head speeds that stretch unspun sliver as it drops into the can, leaving permanent, non-periodic thin stretches.
What specific mathematical correction factor accounts for variable bundle moisture content when capacitance spectrograms display conflicting peak amplitudes across identical hackling lots?


Clamp
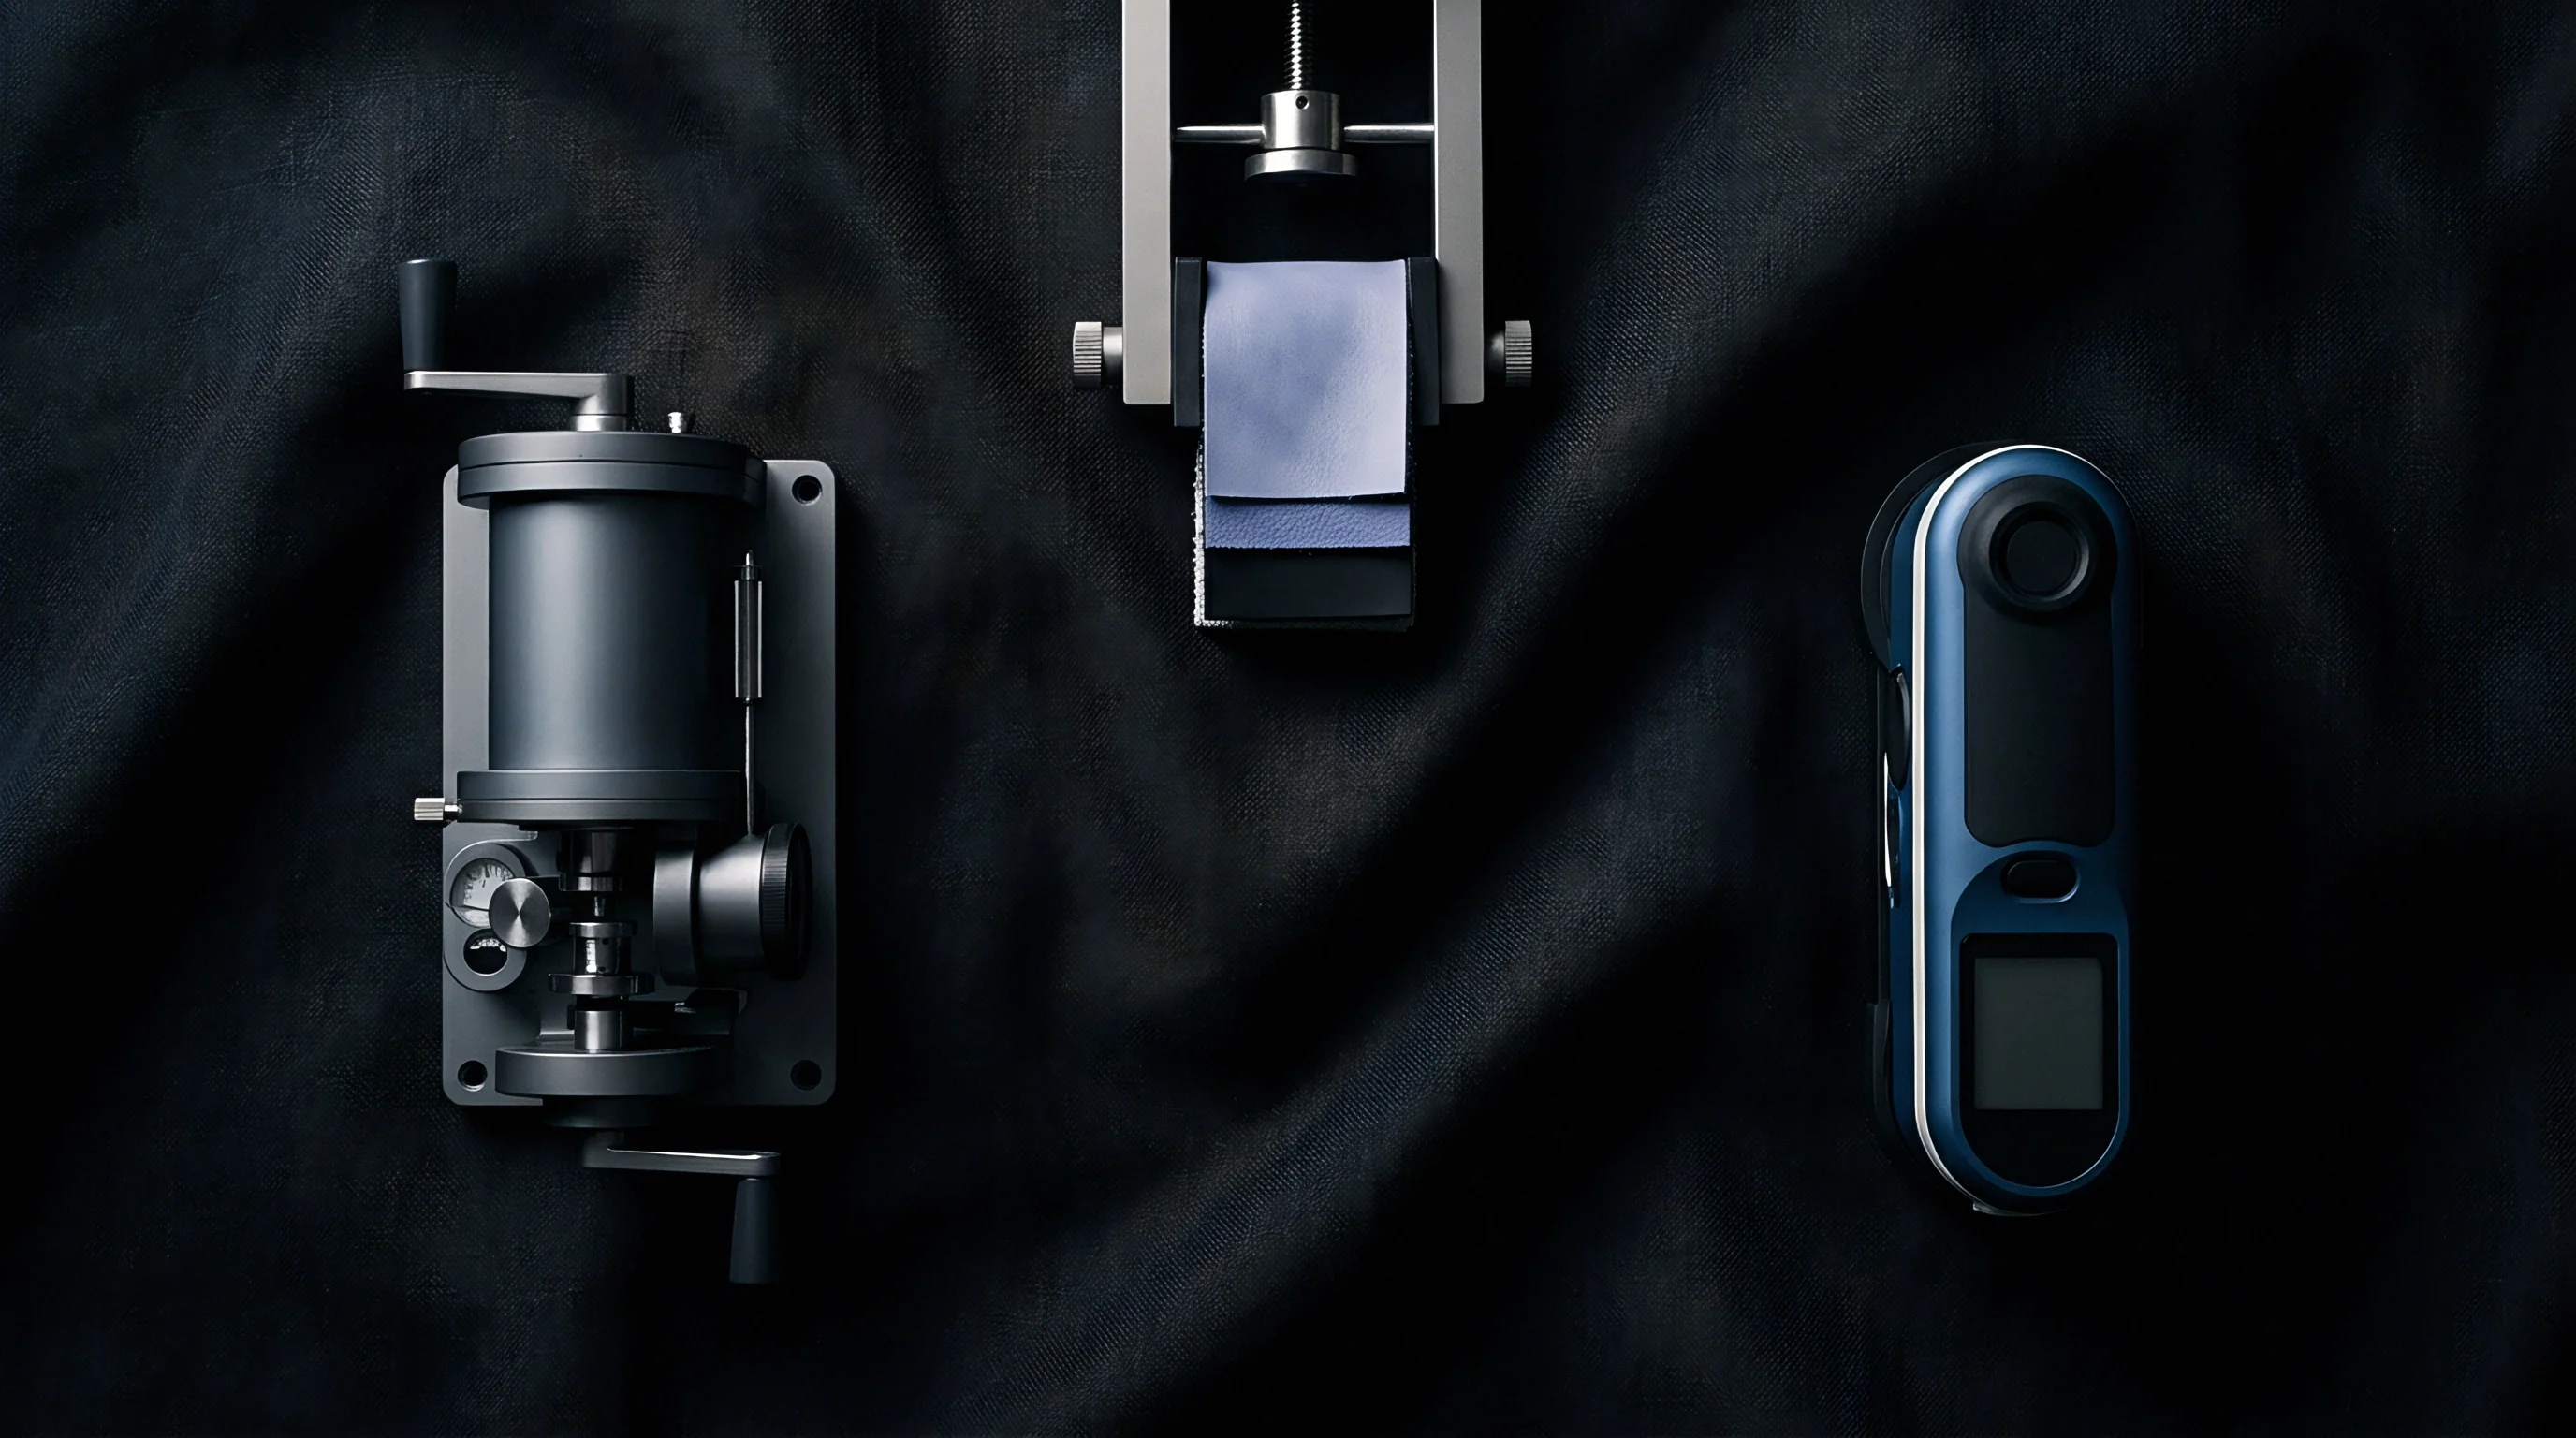
Physical bench methods provide the baseline measurements needed to calibrate automated instruments. Cut-and-weigh tests bypass optical geometry errors and dielectric moisture artifacts, providing direct mass figures in grams per metre or kilotex. Standard mechanical clamp testing measures sliver cohesion directly by evaluating static friction between parallel technical bundles prior to drafting.
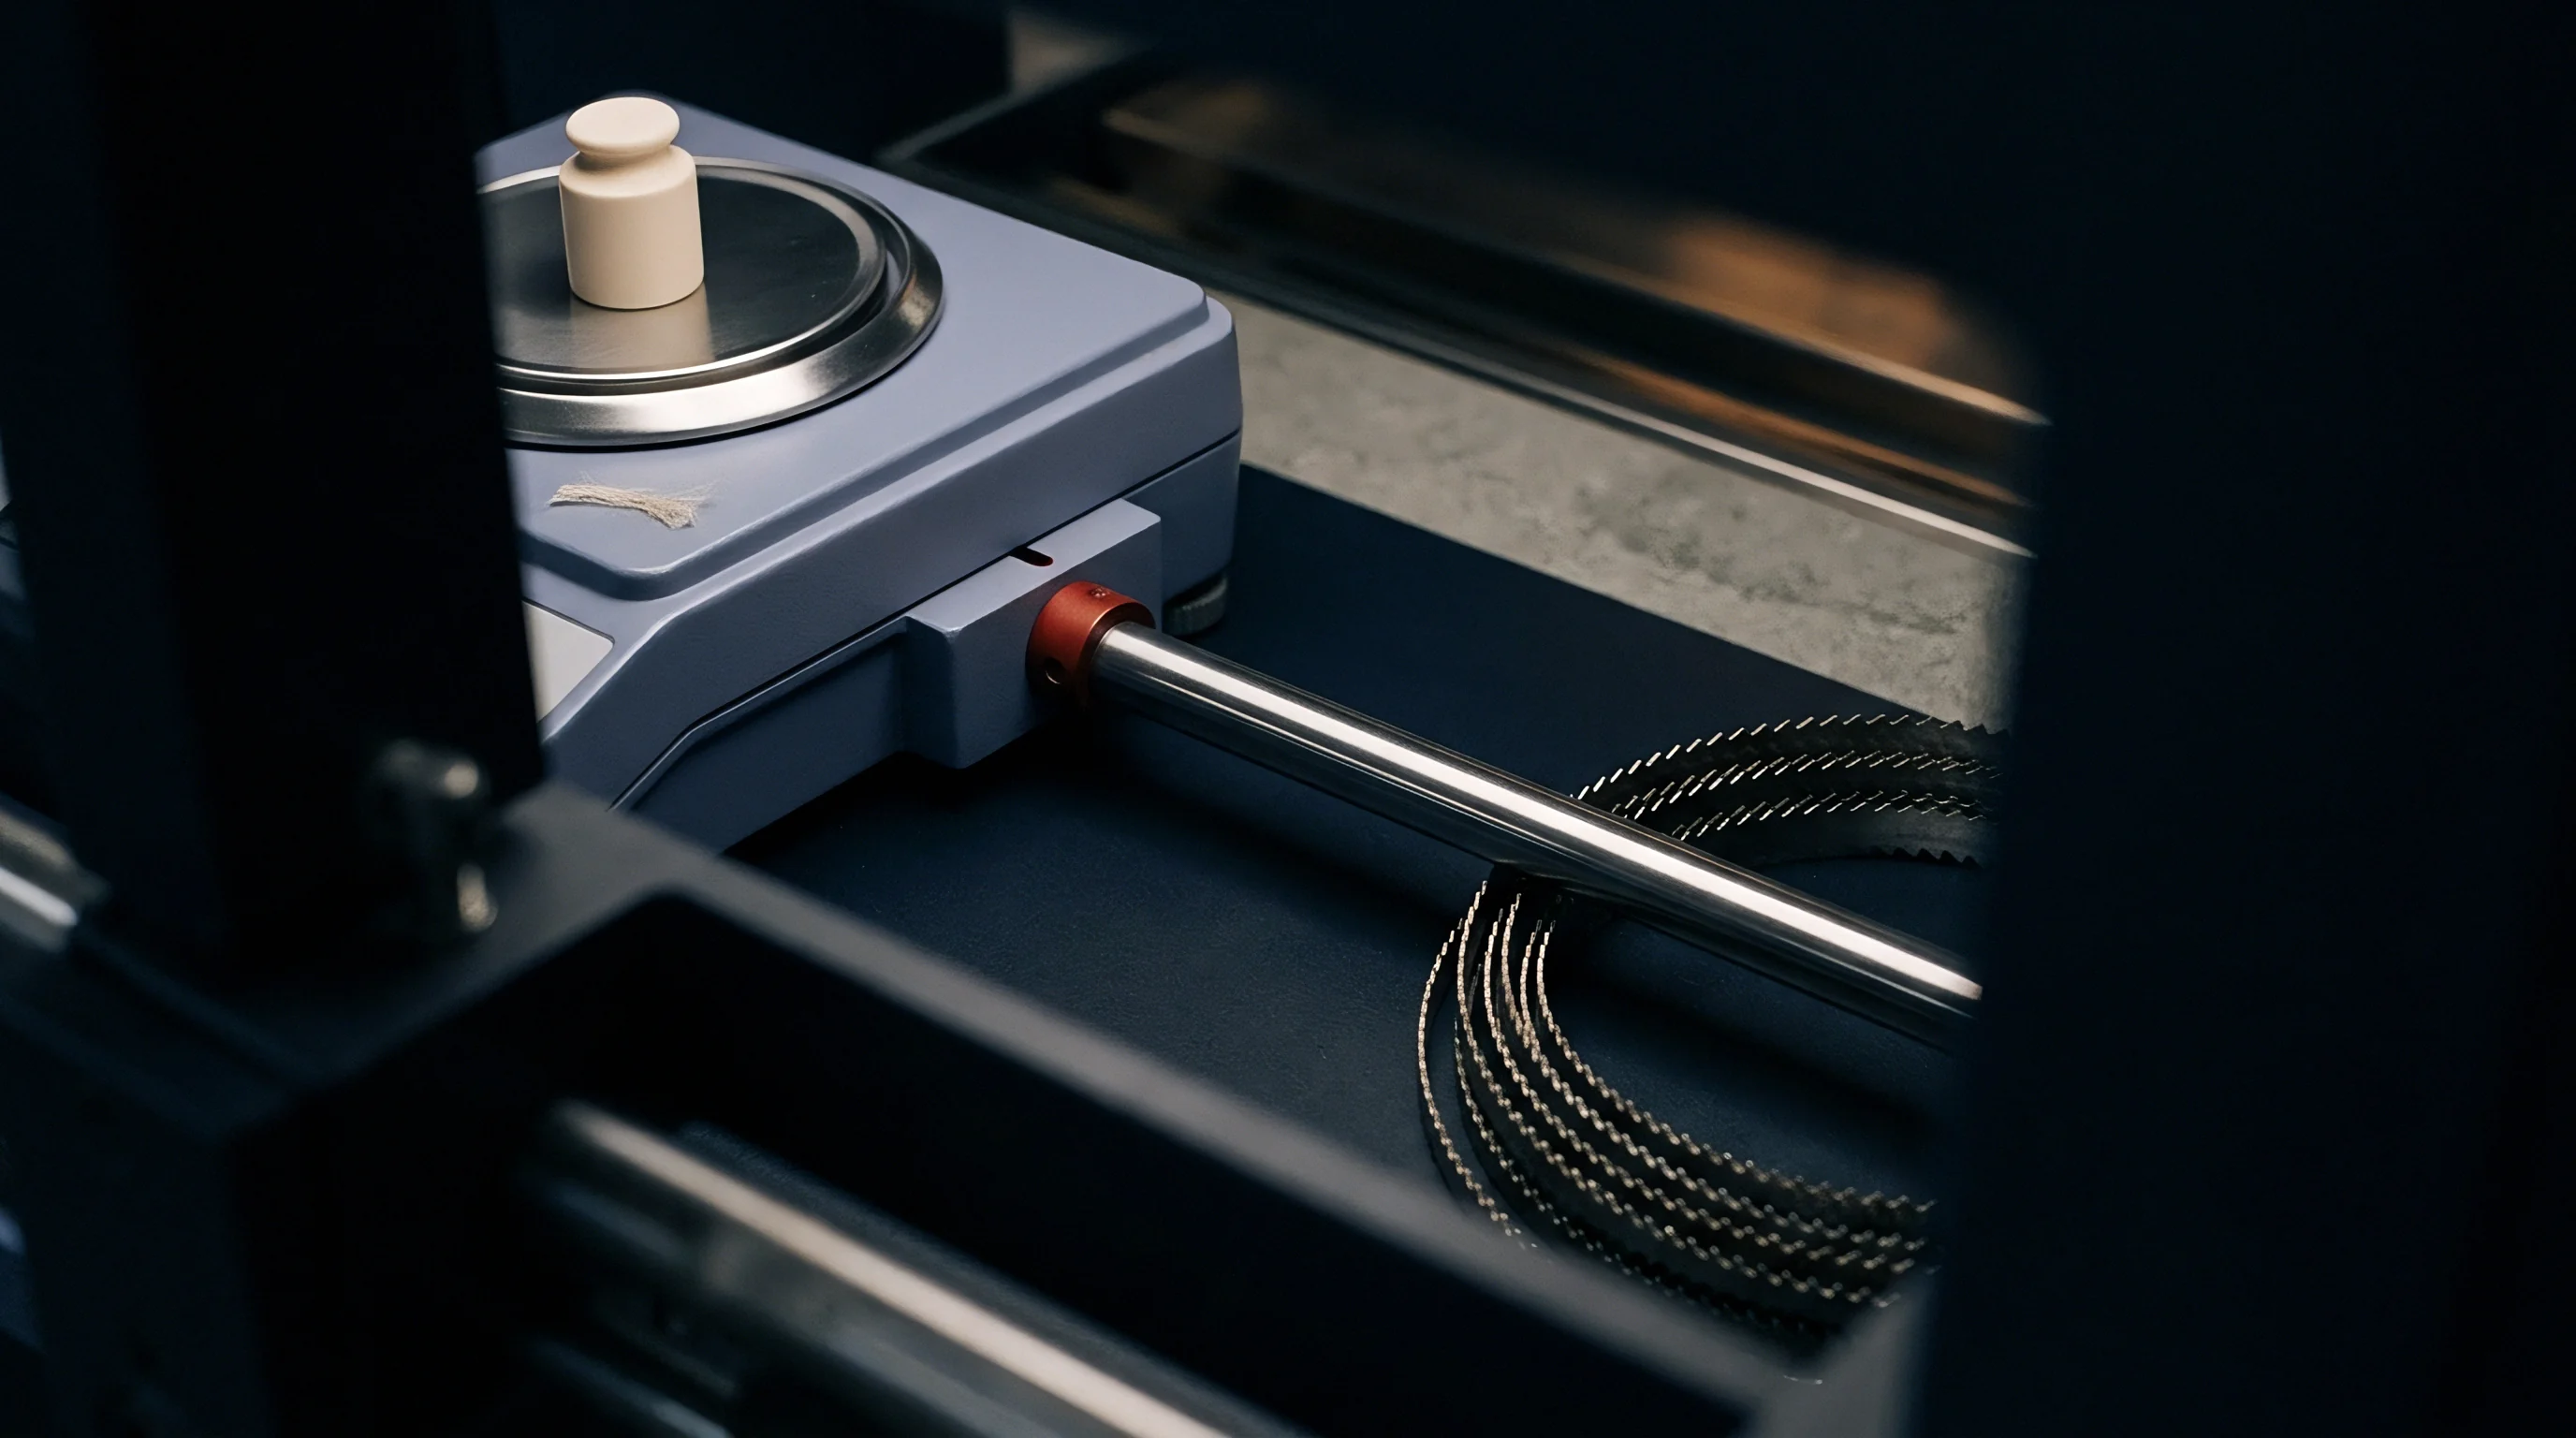
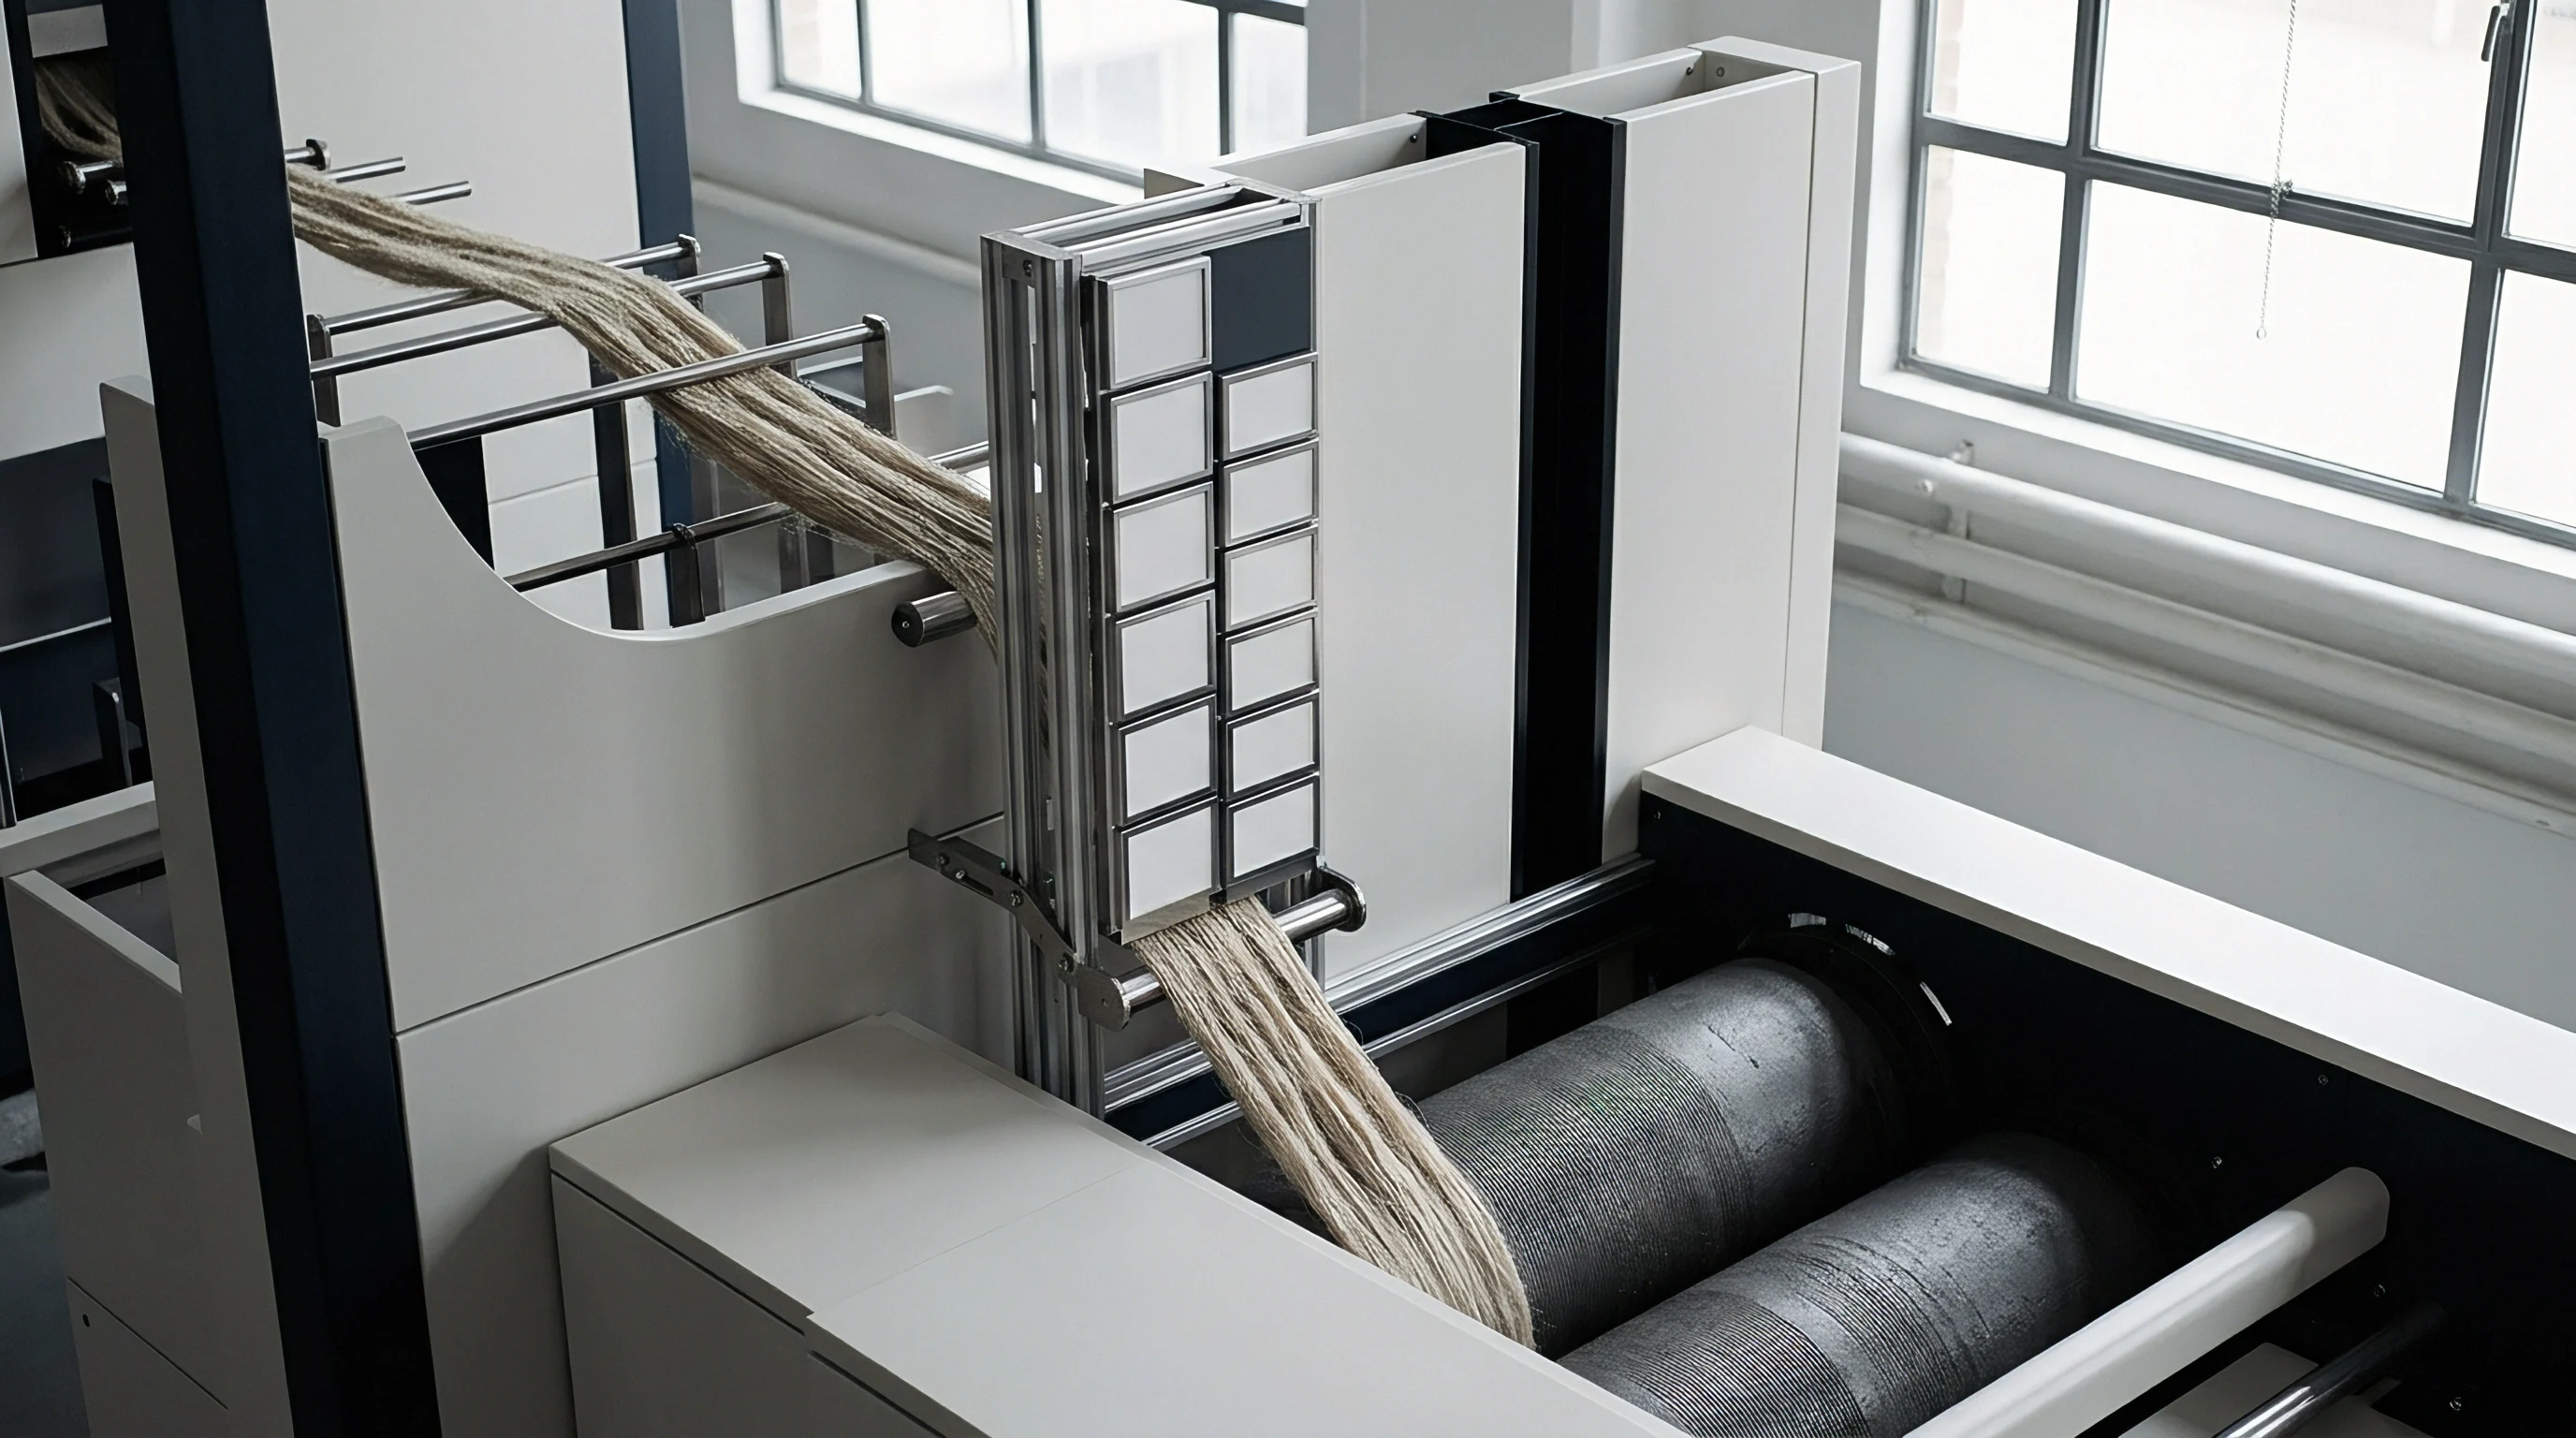
The test requires discarding the outer sliver layer from a can, feeding the strand through a precision template frame with holding clamps, executing exact cuts, and weighing each specimen on an analytical balance precise to 0.1 milligrams. For line flax, sample length directly determines the statistical reliability of the resulting CV%.
Cut and Weigh Protocol Boundaries for Heavy Bast Slivers
Proper sizing of manual cuts prevents edge-truncation errors when measuring linear density. One-metre samples capture mid- and long-term variations, but obtaining a ninety-five percent confidence interval requires sixty cuts per lot. Cuts shorter than fifty centimetres are unsuitable for long-staple flax because technical fibres can reach seven hundred millimetres; a fibre cut by both blades falls free from the bundle, artificially reducing the measured sliver mass.
A ten-metre cut serves as the standard reference length for draw frame output. Collecting ten separate ten-metre samples from different cans across a production lot provides a representative measure of lot-wide linear density drift. The protocol below outlines the standard sequential procedure for gravimetric sliver lot evaluation.
- Discard the outer fifty metres of sliver from each selected sample can to eliminate handling-induced drafting distortion.
- Condition the sliver cans in a standard atmosphere of twenty degrees Celsius and sixty-five percent relative humidity for twenty-four hours.
- Draw a ten-metre length of sliver through a high-precision rotary counter fitted with smooth polyurethane tracking wheels at low clamping tension.
- Make clean perpendicular cuts at the boundary marks using a razor-sharp guillotine cutter to avoid pulling fibres.
- Weigh each cut specimen on an analytical balance calibrated to zero point zero zero one grams.
- Calculate linear density in kilotex by dividing mass in grams by length in metres.
- Compute the lot mean, standard deviation, and overall mass coefficient of variation.
Do Static Pull off Forces Predict Wet Trough Drafting?
Inter-fibre friction within an unspun bundle determines how strands slide past one another in the drafting zone. Measurement involves clamping a sliver specimen between two jaws at a fixed gauge length and applying force until the bundle slips without breaking fibres. This peak force, recorded in newtons per kilotex, reflects inter-bundle cohesion governed by retting thoroughness and residual pectin content.
High pull-off forces indicate under-retted flax containing excess pectin, requiring increased drafting roller pressure and higher trough water temperatures during wet spinning. Low pull-off forces signal over-retted or over-hackled stock where fibres slide too freely, causing uncontrolled drafting and sudden strand breaks in the roving frame back zone. Bench testing provides the empirical physical baseline required to set draft zone nips correctly.
Contractual specifications following ISO 6741 require linear density evaluations to incorporate an exact moisture regain allowance of twelve percent for pure flax sliver.
Bast fibre bundles split unpredictably during mechanical handling, which can make tight cut-and-weigh CV% targets difficult to maintain on commercial draw frames.

Attainment
Achieving tight mass tolerances across spun lots requires precise control over gilling and drafting parameters. Processing scutched flax into uniform wet-spinning sliver requires balancing draft ratios, pin densities, doubling schemes, and bath temperatures. A failure at any single mechanical stage compounds downstream mass variation and transfers defects into the finished yarn.
Doubling reduces random sliver irregularity. When six slivers are fed into a drafting zone, the theoretical CV% of the combined output decreases by the square root of the doubling count, provided individual mass variations are random. However, mechanical flaws such as eccentric rollers bypass this relationship, introducing periodic mass spikes through the draft zone regardless of the doubling count.
Doubling Schemes and Gilling Pin Density Optimization
Combining multiple slivers at the feed plate averages out localized thin spots. Standard processing uses three drawing passages following hackling. The first combines four to six slivers at a draft ratio of five to seven.
The second doubles five slivers at a draft ratio of six. The third doubles four slivers at a draft ratio of five, yielding a total doubling count of one hundred to one hundred and twenty. Increasing total doublings beyond one hundred and fifty risks over-consolidating the fibre ribbon, raising static friction and causing draft-zone surges.
Faller bar pin density must increase with each passage to maintain control over finer bundle structures. First-passage gilling uses a coarse pin setup ~ typically two to three pins per centimetre ~ to process heavy input sliver without jamming or lap-ups. Second-passage gilling increases to five pins per centimetre, while third-passage finishing frames use dense strips with eight to ten pins per centimetre.
Pin geometry must be maintained carefully; bent, burred, or missing pins create open channels where unguided fibres slip through, causing immediate mass spikes.
| Drawing Stage | Input Sliver (ktex) | Doublings | Draft Ratio | Pin Density (pins/cm) | Target Mass CV% |
|---|---|---|---|---|---|
| First Passage (Intersecting) | 20.0 to 25.0 | 5 | 6.0 | 2.5 | 6.5% to 8.0% |
| Second Passage (Intermediate) | 16.0 to 20.0 | 5 | 6.5 | 5.0 | 4.0% to 5.5% |
| Third Passage (Finisher) | 12.0 to 15.0 | 4 | 5.5 | 9.0 | 2.0% to 3.2% |
Pectin Solubilization Dynamics in the Wet Spinning Zone
Passing roving through a hot water bath softens residual middle lamella immediately before final drafting. The hot water weakens pectin bonds. Wet-spinning troughs operate between sixty and seventy degrees Celsius using softened water at controlled pH to prevent scale accumulation on heating elements.
This bath breaks down calcium-pectate complexes binding technical bundles, allowing elementary fibres and micro-bundles to slide smoothly under front-roller tension.
Short trough residence times or insufficient bath temperatures prevent heat from penetrating thick sliver sections. Unwarmed heavy spots remain stiff, resisting draft forces and exiting the front nip as undrafted slubs that cause yarn breaks or structural defects. Maintaining uniform linear density requires matching trough temperature and immersion length directly to the heavy-end mass profile of the sliver lot.
Verifying mill readiness before processing high-value line flax involves auditing six key process controls:
- Faller Pin Integrity requires inspecting pin strips under magnification to spot and replace burred or misaligned pins that cut or snag passing flax bundles.
- Draft Roller Cot Hardness demands checking polyurethane press roll durometer values, maintaining 85 to 90 Shore A hardness to prevent sliver grooving under high nip pressure.
- Autoleveler Sensor Calibration requires running reference slivers through measuring rollers to verify linear voltage-to-draft response across a plus-or-minus twenty percent mass variance range.
- Trough Temperature Stability involves installing dual submerged RTD sensors to ensure water stays within two degrees of the sixty-five-degree target across the full trough width.
- Coiler Tube Clearance requires clearing pectin residue and micro-shive build-up from delivery tubes to prevent friction-induced sliver stretching.
- Relative Humidity Regulation requires holding strict sixty-five percent relative humidity in the drawing bay to prevent static buildup on unspun bast fibres.
Increasing doublings on the second draw frame mitigates long-term periodic mass drift without compounding mechanical drafting waves.
A simple rule of thumb dictates matching faller pin pitch directly to the mean metric fibre number of the hackled lot.

Variance
Downstream spinning performance drops rapidly when intermediate strands exceed baseline irregularity limits. A wet-spinning frame producing fine line flax count NeL 50 (Nm 85 or 11.76 Tex) requires consistent linear density in both the feeding roving and the parent draw-frame sliver. Uncontrolled sliver mass variation leads directly to higher yarn count variation, erratic tensile strength, and reduced weaving efficiency.
When a thin section enters the wet-spinning draft zone, the effective local draft ratio rises because fewer fibres occupy the nip. This thinned bundle cannot sustain the spinning tension applied by the flyer or ring traveller, causing the thread to break.
Operational Consequences of Downstream Count Deviation
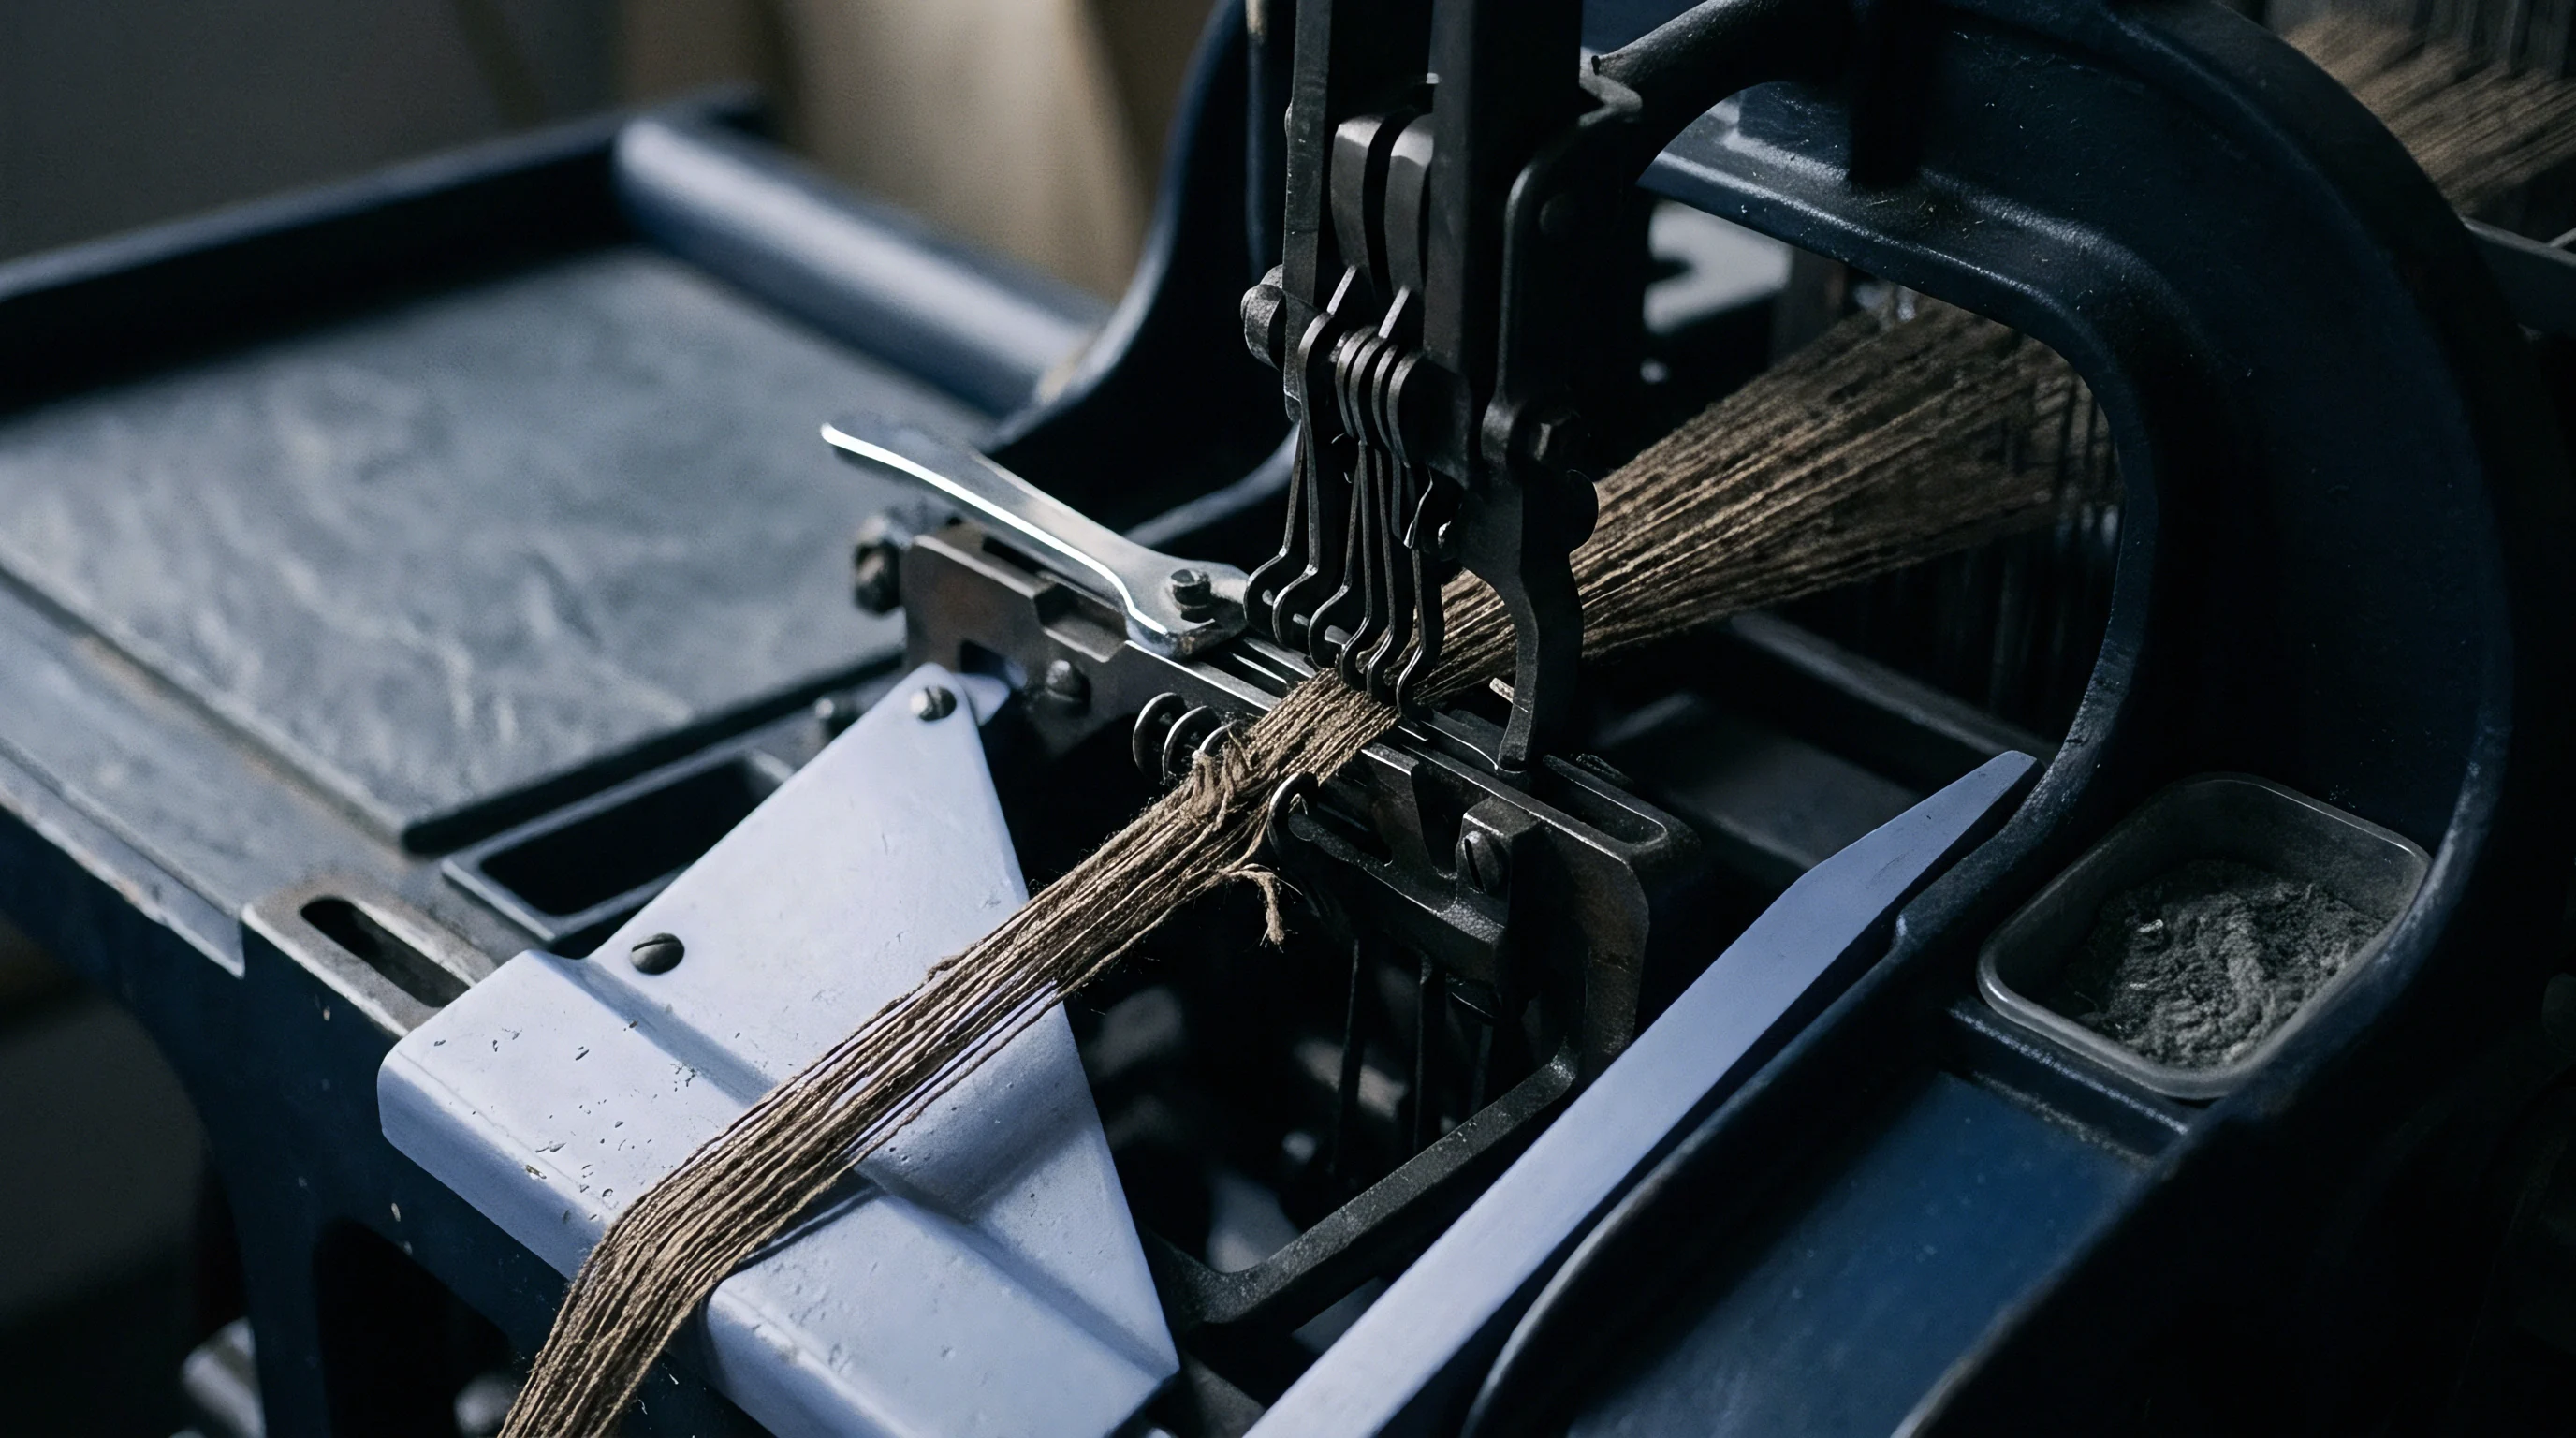
Linear mass fluctuations dictate local yarn strength and linear density along the spun thread. Fine linen wet spinning averages yarn tenacity between 25 and 35 cN/tex. However, a localized thin spot drops tenacity below minimum spinning tension, causing an end break.
Processing five-kilotex sliver with a coefficient of variation exceeding four point five percent yields an end breakage rate of forty-two breaks per thousand spindle hours.
Thick spots cause equal commercial damage. Undrafted heavy sliver sections pass through wet spinning as slubs, entering the yarn package where they jam clearer channels during winding or trigger stops on high-speed air-jet looms. In high-density plain-weave linen fabric woven at 150 g/m2, count variation produces visible horizontal bands known as warp or weft stripiness.
Financial Impact of High Sliver Irregularity on Spindle Efficiency
High end-break rates increase labor costs while reducing total mill output. Consider a wet-spinning unit running 10,000 spindles on NeL 40 fine linen yarn (14.7 Tex) fed from a 4.5 kilotex draw frame sliver lot. Standard baseline operations assume 15 breaks per 1000 spindle hours, achieving 94 percent frame efficiency at 7,500 rpm.
If incoming sliver mass CV% increases from a target 2.5 percent to 4.8 percent, breaks triple to 45 per 1000 spindle hours. Operators cannot keep pace with piecing, forcing frame speed reductions and increasing unspun pneuma-waste from 1.5 percent to 4.2 percent. Pneuma-waste consists of fully drafted, high-value wet flax fibres drawn into suction tubes after a break ~ salvaged only as cheap tow sold at twenty percent of line fibre value.
| Sliver Mass CV% (10m Cuts) | End Break Rate (Breaks/1000 Sp. Hr) | Pneuma-Waste Rate (% Mass) | Spindle Efficiency (%) | Weekly Mill Output (kg) | Landed Net Yarn Cost ($/kg) | Landed Fabric Cost Impact ($/m) |
|---|---|---|---|---|---|---|
| 1.8% to 2.2% (Premium Line) | 10 | 1.1% | 96.2% | 12,450 | $28.50 | Baseline ($0.00) |
| 2.3% to 2.8% (Standard Line) | 16 | 1.6% | 93.8% | 12,140 | $29.40 | +$0.18 |
| 2.9% to 3.5% (Marginal Lot) | 28 | 2.8% | 88.5% | 11,450 | $31.80 | +$0.66 |
| 3.6% to 5.0% (Rejected Lot) | 48 | 4.9% | 79.2% | 10,250 | $36.20 | +$1.54 |
Determining financial loss requires modeling waste conversion rates alongside operator labor overhead. Increased sliver mass variation adds $2.40 per kilogram in direct costs at the spinning frame alone, before accounting for fabric yield losses from mending or removing slub defects. When converting raw fibre into finished cloth at a target weight of 150 grams per square metre, an uneven sliver lot raises finished fabric costs by over one dollar per metre.
Quality certificates accompanying incoming sliver shipments must document six analytical data fields:
- Gravimetric Test Certifications detailing mean linear density in kilotex, sample length, total cuts weighed, and calculated mass CV% per ISO 1973 methods.
- Spectrogram Wavelength Profiles showing mass variation amplitudes from 1 centimetre to 100 metres to verify the absence of mechanical periodic drafting waves.
- Conditioned Weight Adjustments reporting raw sample mass, moisture content percentage determined by oven drying, and commercial mass calculated via ISO 6741 regain standards.
- Hackling and Drawing Traceability Logs listing raw flax origin batch codes, hackling line speed, spreader feeding parameters, and total doublings applied across drawing passes.
- Fibre Bundle Fineness Spectra presenting metric fibre number (Nm) distributions determined by micro-projection or airflow resistance per ISO 2370.
- Static Inter-Fibre Cohesion Values recording pull-off forces in newtons per kilotex under standardized clamp gauge distances.
Evaluating downstream spinning performance involves correlating sliver irregularity with frame end breaks to verify whether incoming lots will sustain targeted spindle speeds. Efficiency losses compound rapidly when multiple sliver cans show synchronized long-term mass drift, starving entire frame sides with low-density feed over extended runs.

Settlement
Commercial trade in textile intermediates relies on standardized acceptance testing. Purchasing wet-spun flax sliver in bulk cans or bumped tops requires enforceable contract terms covering linear density metrics, moisture regain allowances, sampling frequency, and price adjustments. Without explicit numerical thresholds in the purchase order, buyers bear the financial risk of poor spinning yields.
Sourcing agreements must state both target mean linear density in kilotex and maximum allowable CV% across ten-metre cut samples. Contracts need to reference international standard test procedures explicitly ~ defining atmospheric conditioning, sample purging routines, and approved test instruments for arbitration.

Contractual Tolerance Windows for Commercial Sliver Lots
Specification sheets establish the boundaries for lot rejection and price adjustments. For high-grade line flax sliver intended for fine wet spinning (NeL 40 to NeL 60), standard contracts specify a mean linear density tolerance within plus-or-minus two percent of nominal kilotex. Mass variation rules require ten-metre cut CV% below 2.5 percent, with short-term capacitive CV% (1 cm equivalent cut length) under 4.0 percent.
When an incoming lot exceeds agreed mass CV% limits, contract terms trigger tiered price penalties or rejection clauses. Standard commercial practice applies a one-to-one price discount for every percentage point that sliver CV% exceeds specification up to a four percent ceiling. Beyond four percent variation, the buyer retains the right to reject the container shipment outright, charging return freight and downtime costs to the processor.
Sampling Frameworks for Incoming Sliver Can Audits
Statistical sampling plans dictate how many sliver cans are tested from a shipment. Under ISO 2859-1 normal inspection level II single sampling, a fifty-thousand-kilogram shipment in five-hundred-kilogram cans requires sampling eight cans at random across different pallet locations.
Testing requires three separate ten-metre samples from each selected can, providing twenty-four data points to calculate lot mean and variance. If the sample mean strays more than two percent from nominal kilotex, or if lot CV% exceeds contract limits, re-inspection follows double sampling protocols. A second failure triggers formal rejection, protecting the mill from running substandard stock.
Capacitance test results obtained without twenty-four hours of climate equalization systematically report artificial mass variations.
Standard contract clauses for fine line flax sliver require linear density and mass uniformity to be determined per ISO 1973 using ten-metre cut samples conditioned under ISO 6741. Rejection triggers automatically if ten-metre cut CV% exceeds two point eight percent, or if dielectric spectrograms show periodic mass peaks over one point five times baseline amplitude at wavelengths between two and fifty centimetres.