Predictive Optical Image Analysis of Raw Flax Sliver Structure for Real-Time Hackling Yield Allocation
Multi-spectral optical image analysis of raw flax sliver enables real-time hackling comb adjustments, increasing long line yield by over 7 percent.


Lens
Optical image acquisition on high-speed flax processing lines requires specialized hardware to capture the structural complexity of unhackled scutched sliver. Moving through feed troughs at 1.2 to 2.5 metres per second, unprocessed bast fibre bundles show wide spatial variation in alignment, cortical cell wall thickness, and residual shive contamination. Standard monochrome area-scan sensors cannot resolve individual elementary fibre boundaries inside dense technical bundles; motion blur and weak spectral contrast between lignified shive particles and cellulosic cell walls obscure the detail.
Line-scan architectures solve the motion blur by locking sensor line rates directly to encoder signals driven by feed-roller shaft rotation.
A dual-light multi-spectral imaging assembly creates the illumination gradient needed to distinguish outer epidermal shive fragments from core bast fibre bundles. Narrowband 405 nanometer violet LED line lights, set at a 30-degree glancing angle, produce surface scatter that highlights high-density lignified shive walls. Beneath a quartz glass guide plate, an 850 nanometer near-infrared backlighting array penetrates the bundle assembly to reveal internal density variations and crossing angles.
A 16,384-pixel monochrome CMOS line-scan camera operating at an 80 kilohertz line rate provides spatial resolution down to 12.5 micrometres per pixel across a 200-millimetre optical field of view. This threshold resolves technical fibres measuring 15 to 40 micrometres in diameter and flags shive fragments over 50 micrometres.
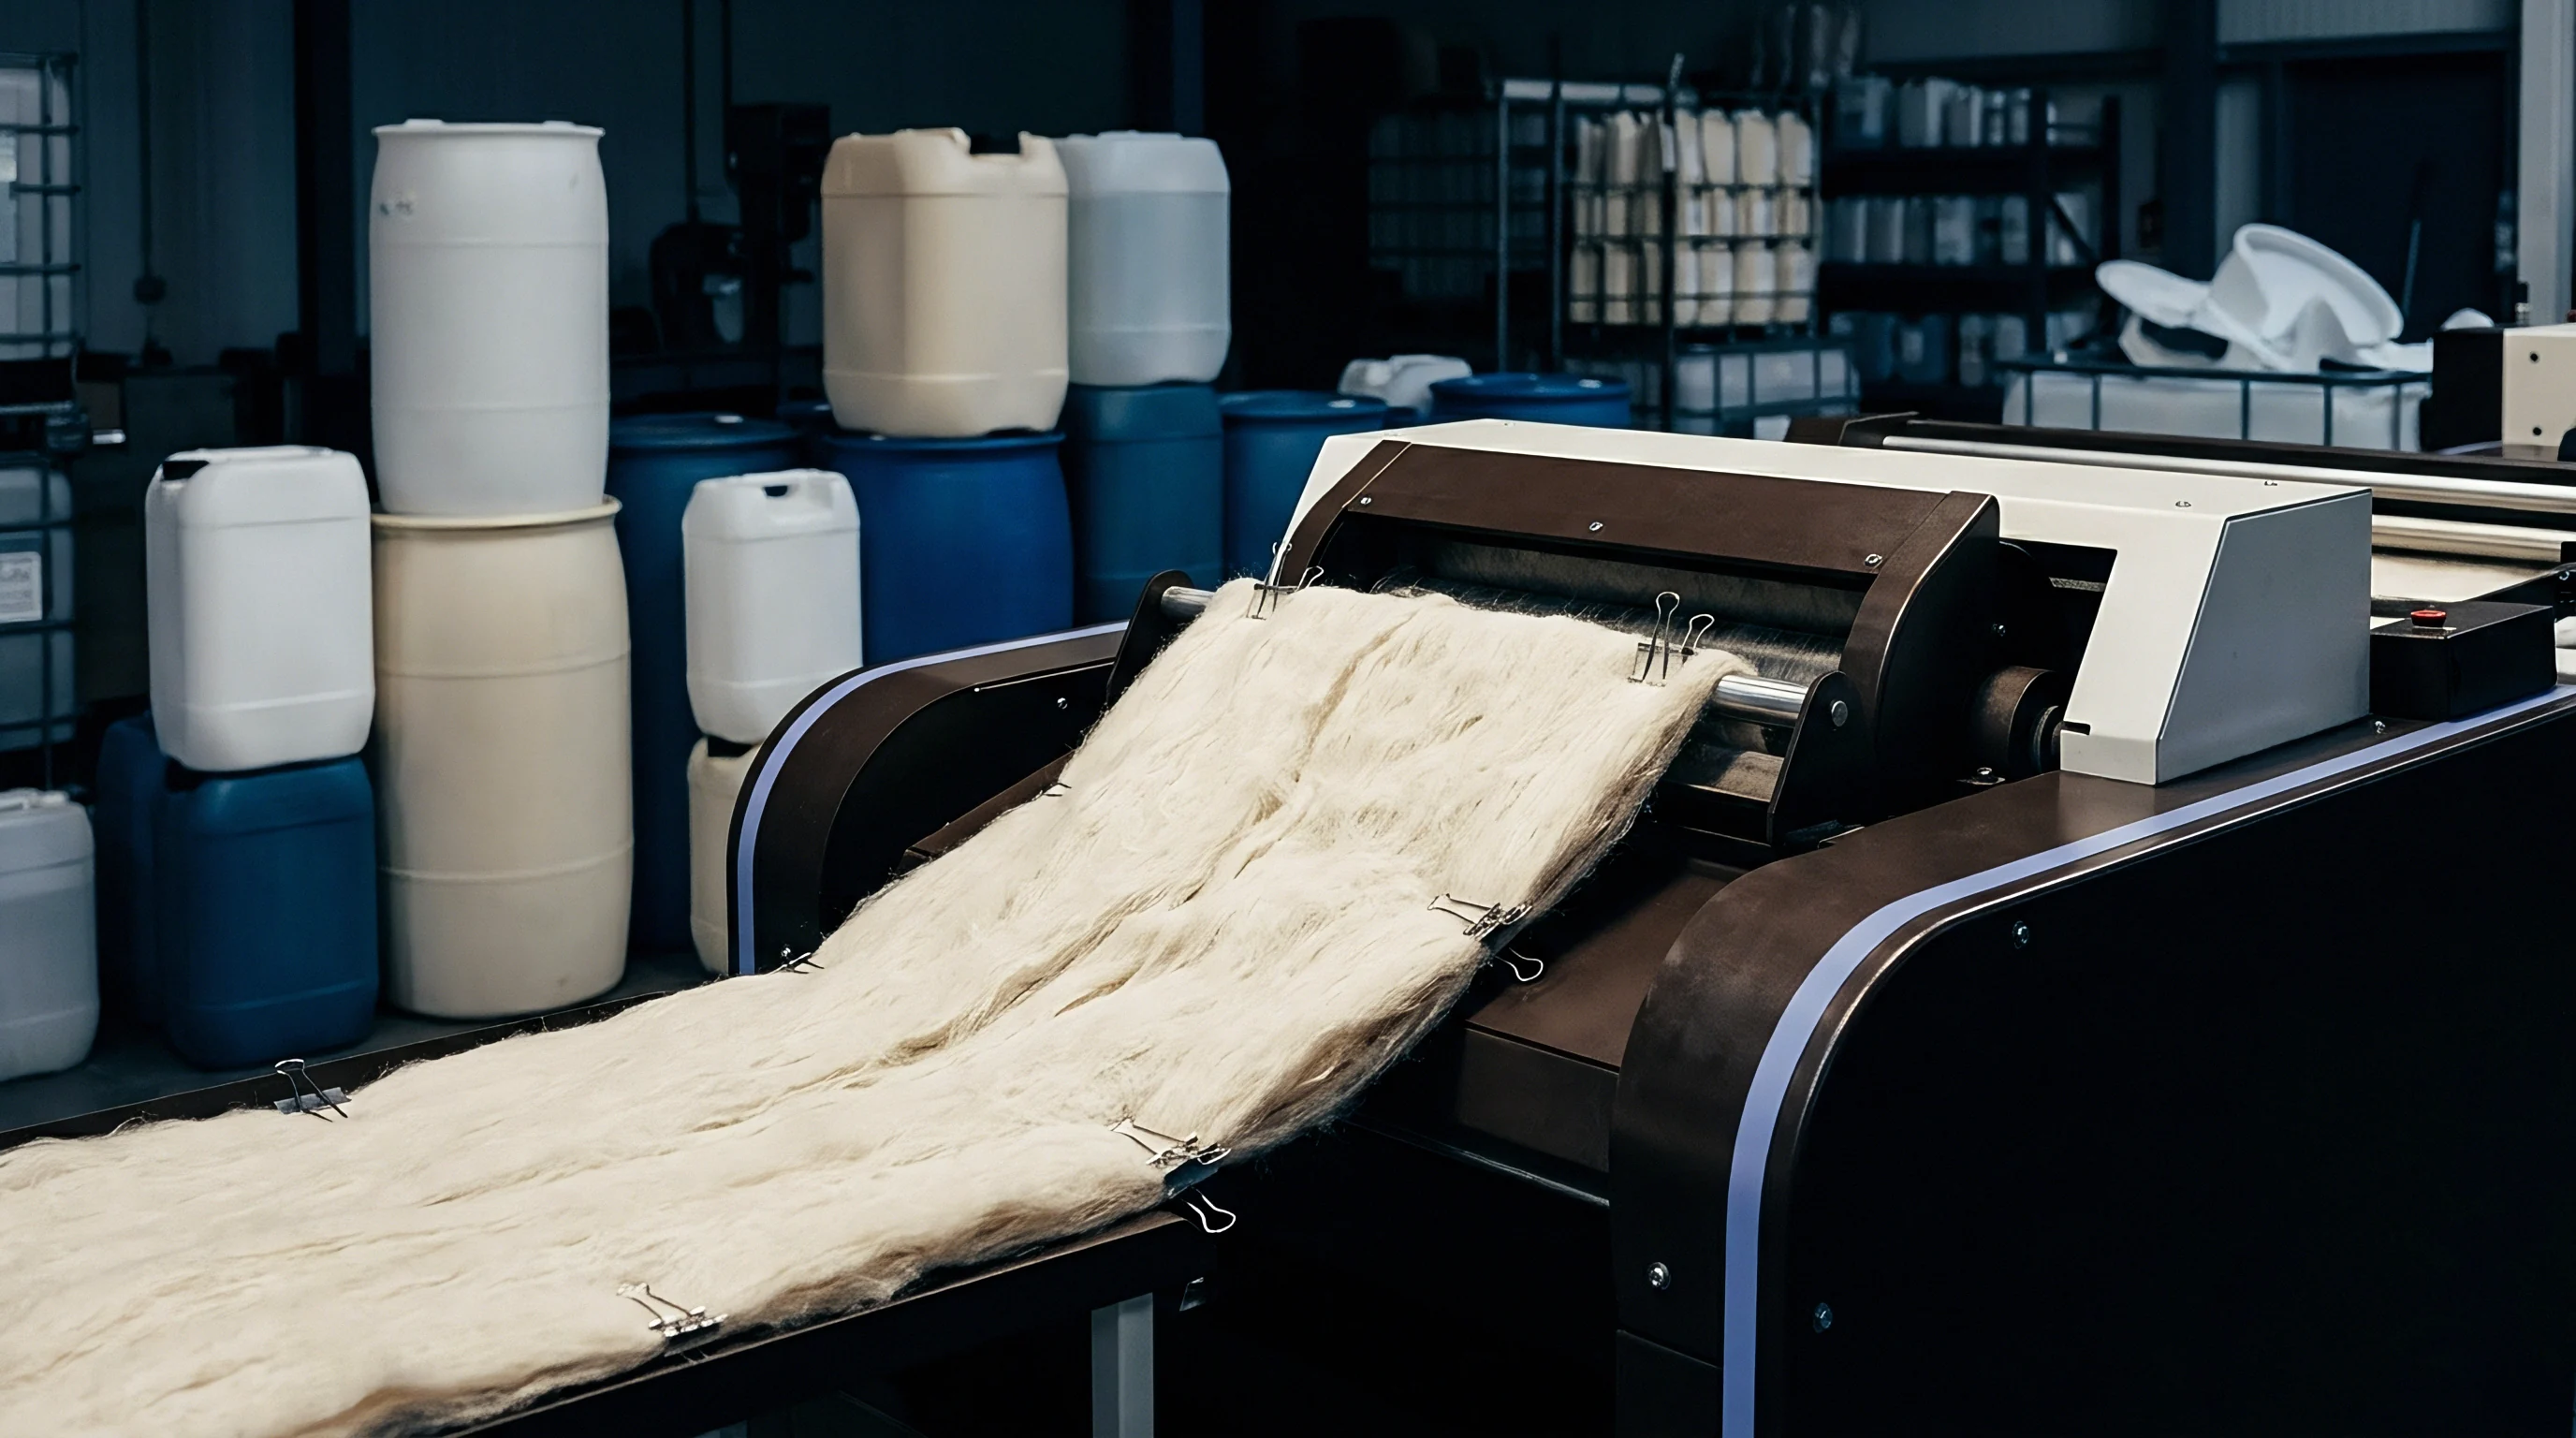
Optical Hardware Configuration and Mechanical Stabilization
Vibration in hackling feed units distorts optical depth of field, blurring fibre boundaries and corrupting feature extraction algorithms. Stabilization mechanisms must steady the moving sliver across the optical plane without generating static charge or damaging fibres through friction. A dual pneumatic assembly clamps the sliver between two optical-grade synthetic sapphire plates ground to a surface flatness of one-quarter wavelength.
Low-pressure air cushions maintain a constant 1.5-millimetre gap between the plates, preventing physical binding while dampening vertical sliver flutter to under 50 micrometres at full transport speeds.
Calibration routines run continuously to offset LED thermal drift and dust buildup on the sapphire windows. Every 30 minutes during operation, the system runs a flat-field correction cycle by sampling a motorized white ceramic calibration tile built into the camera frame. Modulating light output keeps signal intensity stable across all 16,384 sensor elements within a 0.5 percent variance.
Upstream high-velocity ionized air knives neutralize static charges, preventing fly fibres and shive dust from settling on the optical glass.
An optical bench mount isolates camera sensors from the low-frequency vibrations of heavy hackling drives. Optical alignment holds focus across three shifts a day without manual operator intervention. The continuous data stream feeds directly into field-programmable gate arrays via Camera Link protocols, handling pixel preprocessing and frame segmentation at line speed.

Sensor Positioning and Environmental Control
Positioning the optical assembly relative to the main hackling comb drums is critical. Mounting sensors too far upstream yields inaccurate real-time comb adjustments because transport tension alters sliver structure. Conversely, placing optics inside the active comb zone exposes lenses to severe dust, heavy vibration, and damage from moving pins.
The optimal inspection point sits 350 millimetres upstream of the first pinned hackling drum, immediately after the draft rollers.
Temperature fluctuations in preparation halls shift optical focus as camera mounts expand and contract relative to the sensor plane. Enclosing the optical head in a sealed, climate-controlled aluminum housing keeps internal conditions at 22 degrees Celsius within 0.5 degrees. Closed-loop thermoelectric coolers dissipate heat from line-scan sensor boards and high-output LED drivers to protect signal-to-noise ratios from thermal noise.
Maintaining positive internal pressure via a continuous purge of dry, oil-free compressed air keeps ambient flax dust from settling on internal filters or lenses.
The 405 nanometer illuminator reveals surface shive boundaries by generating a three-to-one signal contrast ratio over cellulosic bast fibre walls.
Industrial dust extraction ducts surrounding the glass sandwich frame capture airborne lint before it crosses the optical path. Hood velocity is held at 18 metres per second to balance dust collection against physical sliver disturbance. Under these controls, the sensors maintain target spatial resolution across continuous 120-hour production runs without manual lens cleaning or realignment.
Unretted green flax exhibits inherent spectral variance that interferes with multi-spectral imaging models.


Metric
Automated image processing algorithms convert continuous line-scan data into discrete structural metrics that govern downstream yield allocation. Raw image pipelines perform real-time spatial transformations, contrast adjustments, and morphological segmentation on 1,024-line blocks streamed from field-programmable gate arrays. Fast Fourier transforms convert spatial image arrays into frequency domain representations, separating parallel fibre bundle alignments from cross-oriented entanglements and disordered neps.
Gabor filter banks tuned to specific orientation angles map directionality across the full sliver width, yielding localized orientation coherence scores from zero for complete disorder to one for perfect axial alignment.
Technical bundle width distributions are extracted using adaptive thresholding to isolate background light from fibre shadows. Binarized images pass through morphological erosion and dilation steps, detaching overlapping bundles without altering physical boundaries. Measuring bundle cross-sectional width at five-micrometre intervals along the longitudinal axis produces continuous fineness histograms.
Converting these spatial width measurements into metric fibre numbers enables real-time assessment of long line potential before hackling combs engage the material.
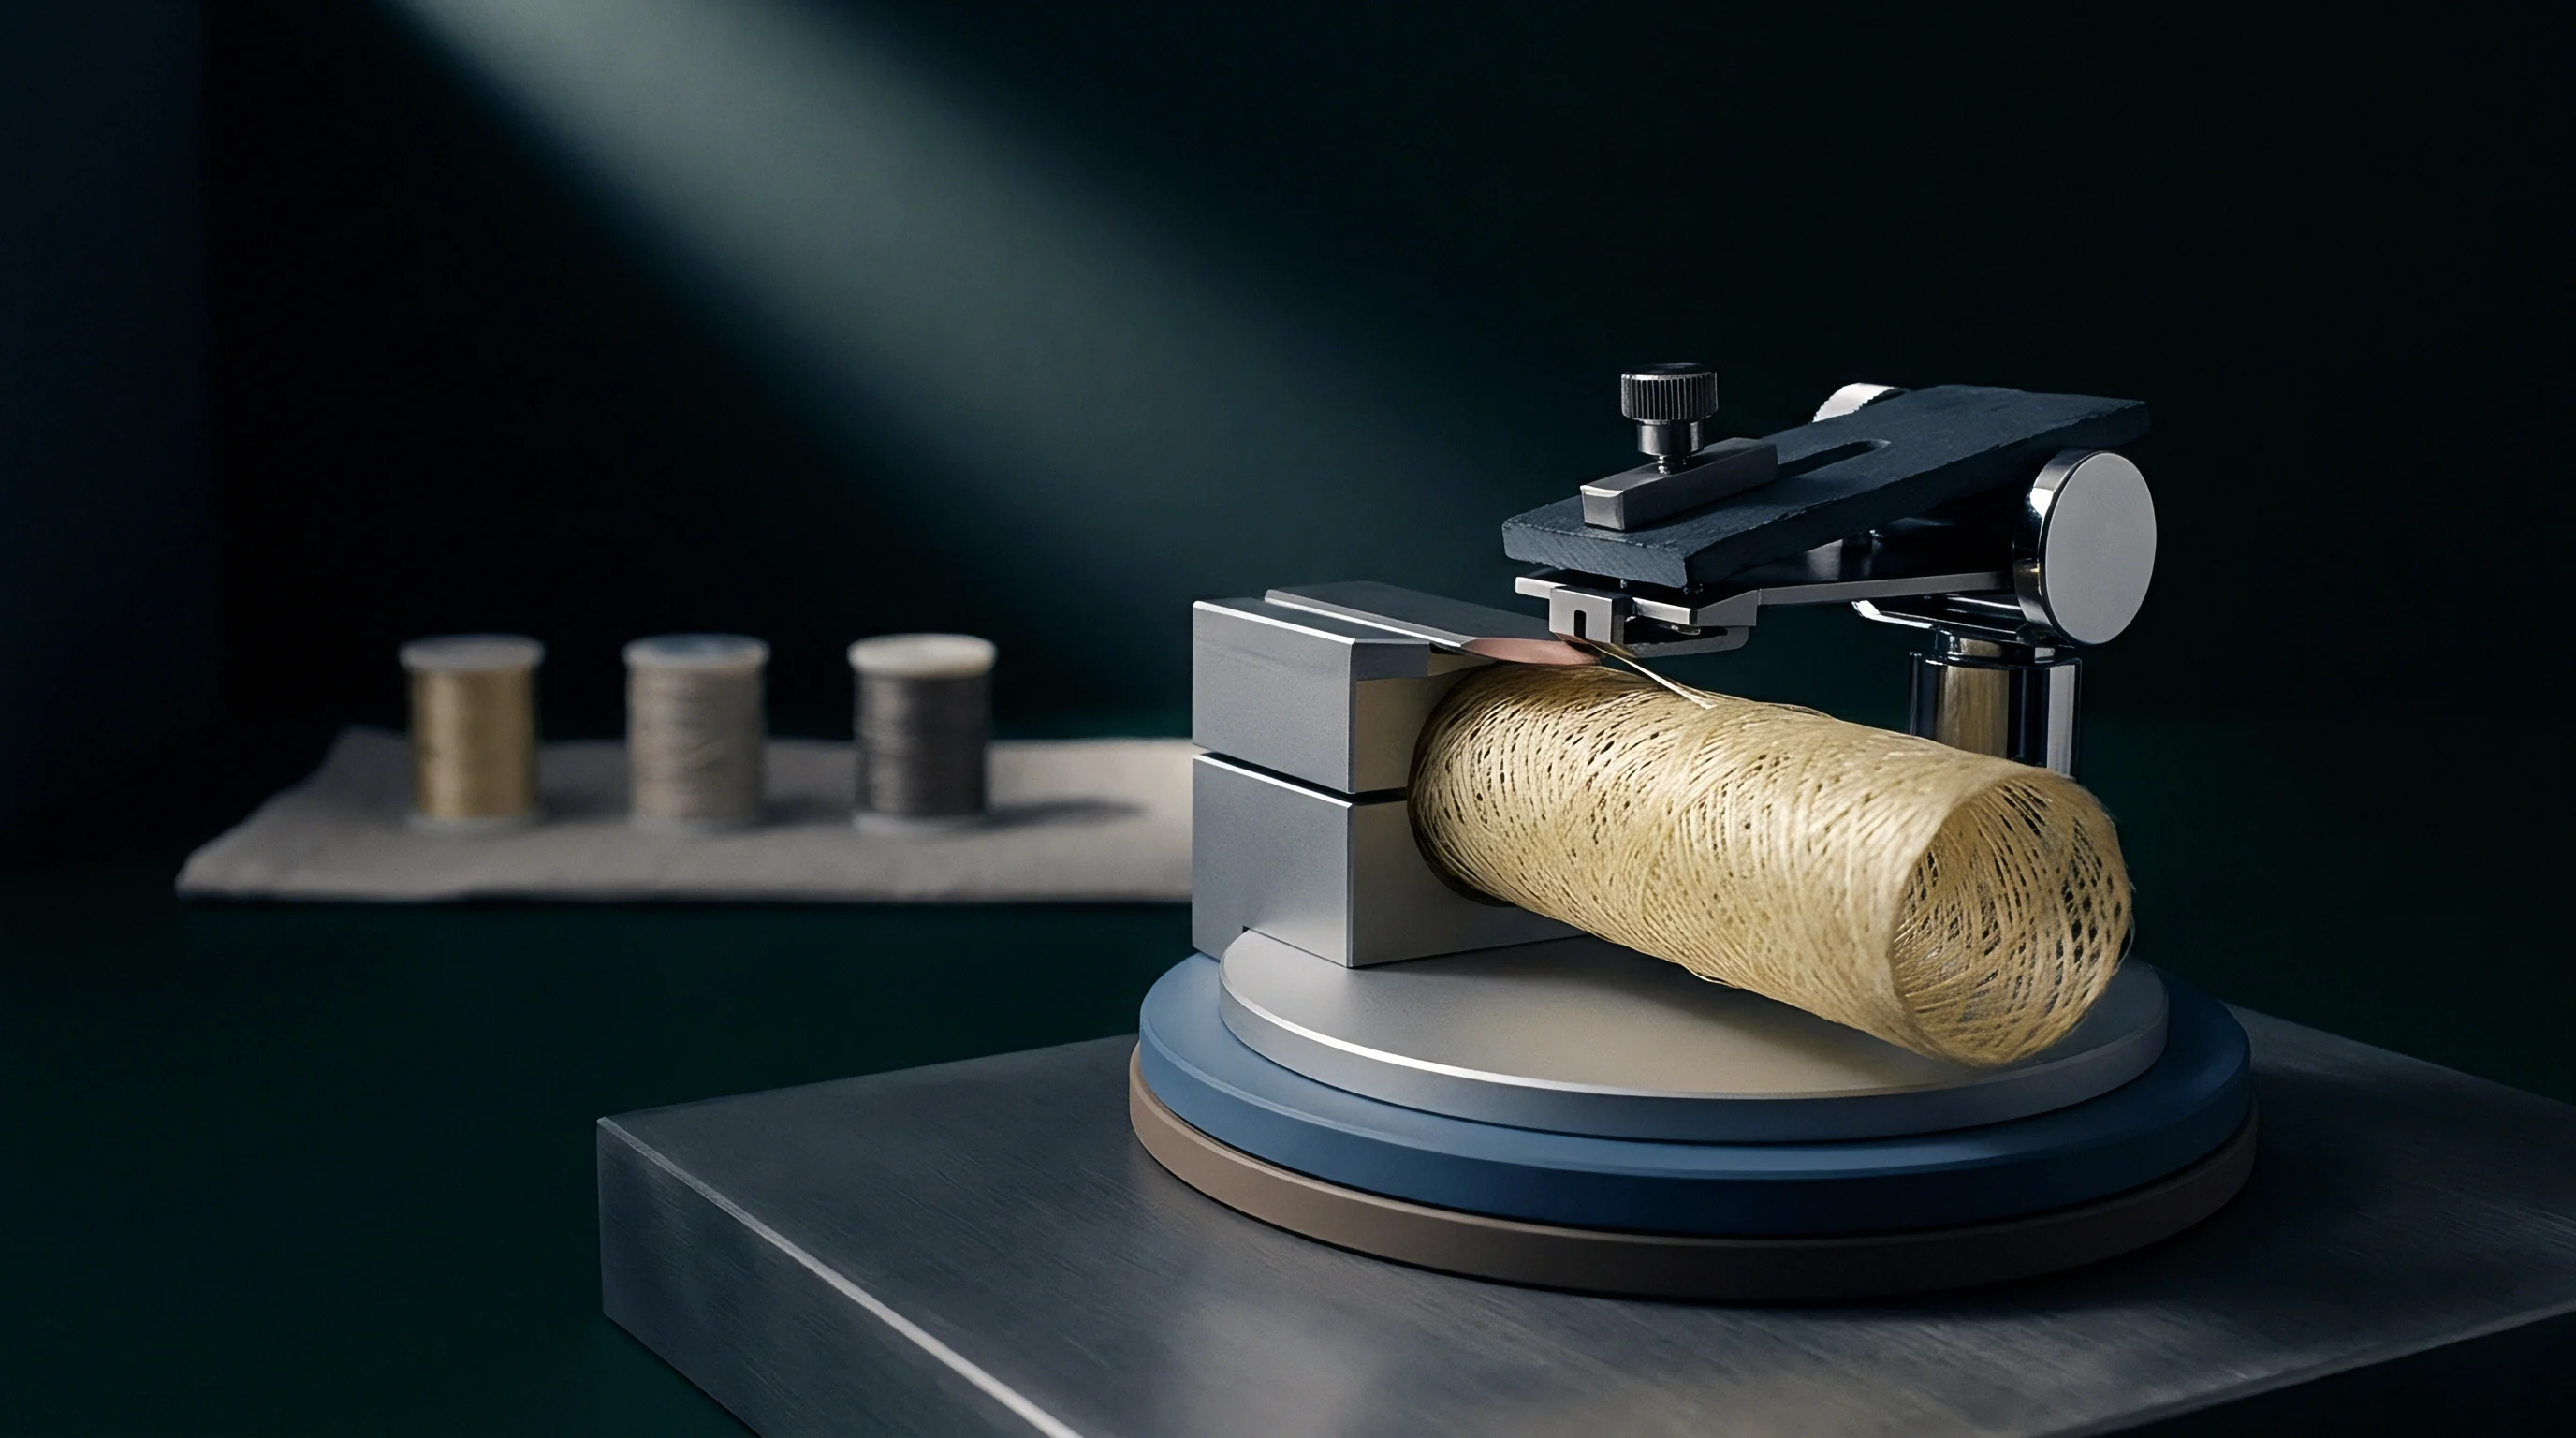
Quantitative Characterization of Fiber Defects and Structural Non-Uniformity
Shive fragments and neps are the principal structural defects that reduce hackling yield and weaken spun yarn. Distinguishing shive fragments from dense fibre knots relies on multi-spectral pixel classification algorithms that evaluate spectral intensity ratios across violet and near-infrared bands simultaneously. Lignified shive absorbs 405 nanometer violet light while reflecting 850 nanometer near-infrared radiation, producing a distinct spectral signature that separates shive particles from compact cellulosic neps.
The vision pipeline calculates total shive surface area fraction, particle size distribution, and spatial defect frequency along every metre of sliver.
Nep detection pairs localized optical density variations with shape factor analysis. Circularity metrics evaluate detected pixel blobs, flagging compact entities with high optical density and high perimeter-to-area ratios as neps or un-retted bark fragments. Tracking nep counts per gram gives early warning when raw material exceeds downstream processing limits.
Retting homogeneity indices derive from density variance across the sliver cross-section; uniform flax produces a narrow distribution curve, whereas under- or over-retted lots display skewed profiles indicating uneven chemical breakdown of intercellular pectin matrices.
| Feature Parameter | Detection Waveband | Algorithmic Method | Targeted Physical Property | Process Control Threshold |
|---|---|---|---|---|
| Orientation Coherence | 850 nm NIR | Gabor Filter Tensor Analysis | Axial Bundle Parallelism | Greater than 0.82 Coherence Score |
| Bundle Width Histogram | 850 nm NIR | Adaptive Edge Segmentation | Mean Technical Fibre Fineness | 22 to 38 Micrometres Mean Range |
| Shive Area Fraction | 405 nm Violet | Dual-Band Ratio Thresholding | Residual Shive Defect Load | Less than 1.45 Percent Area Ratio |
| Nep Frequency Index | 405 nm / 850 nm | Blob Morphology and Circularity | Entangled Fibre Knots per Metre | Below 12 Neps per Gram |
| Retting Homogeneity Index | 850 nm NIR | Density Histogram Variance | Pectin Matrix Degradation | Standard Deviation under 0.08 |
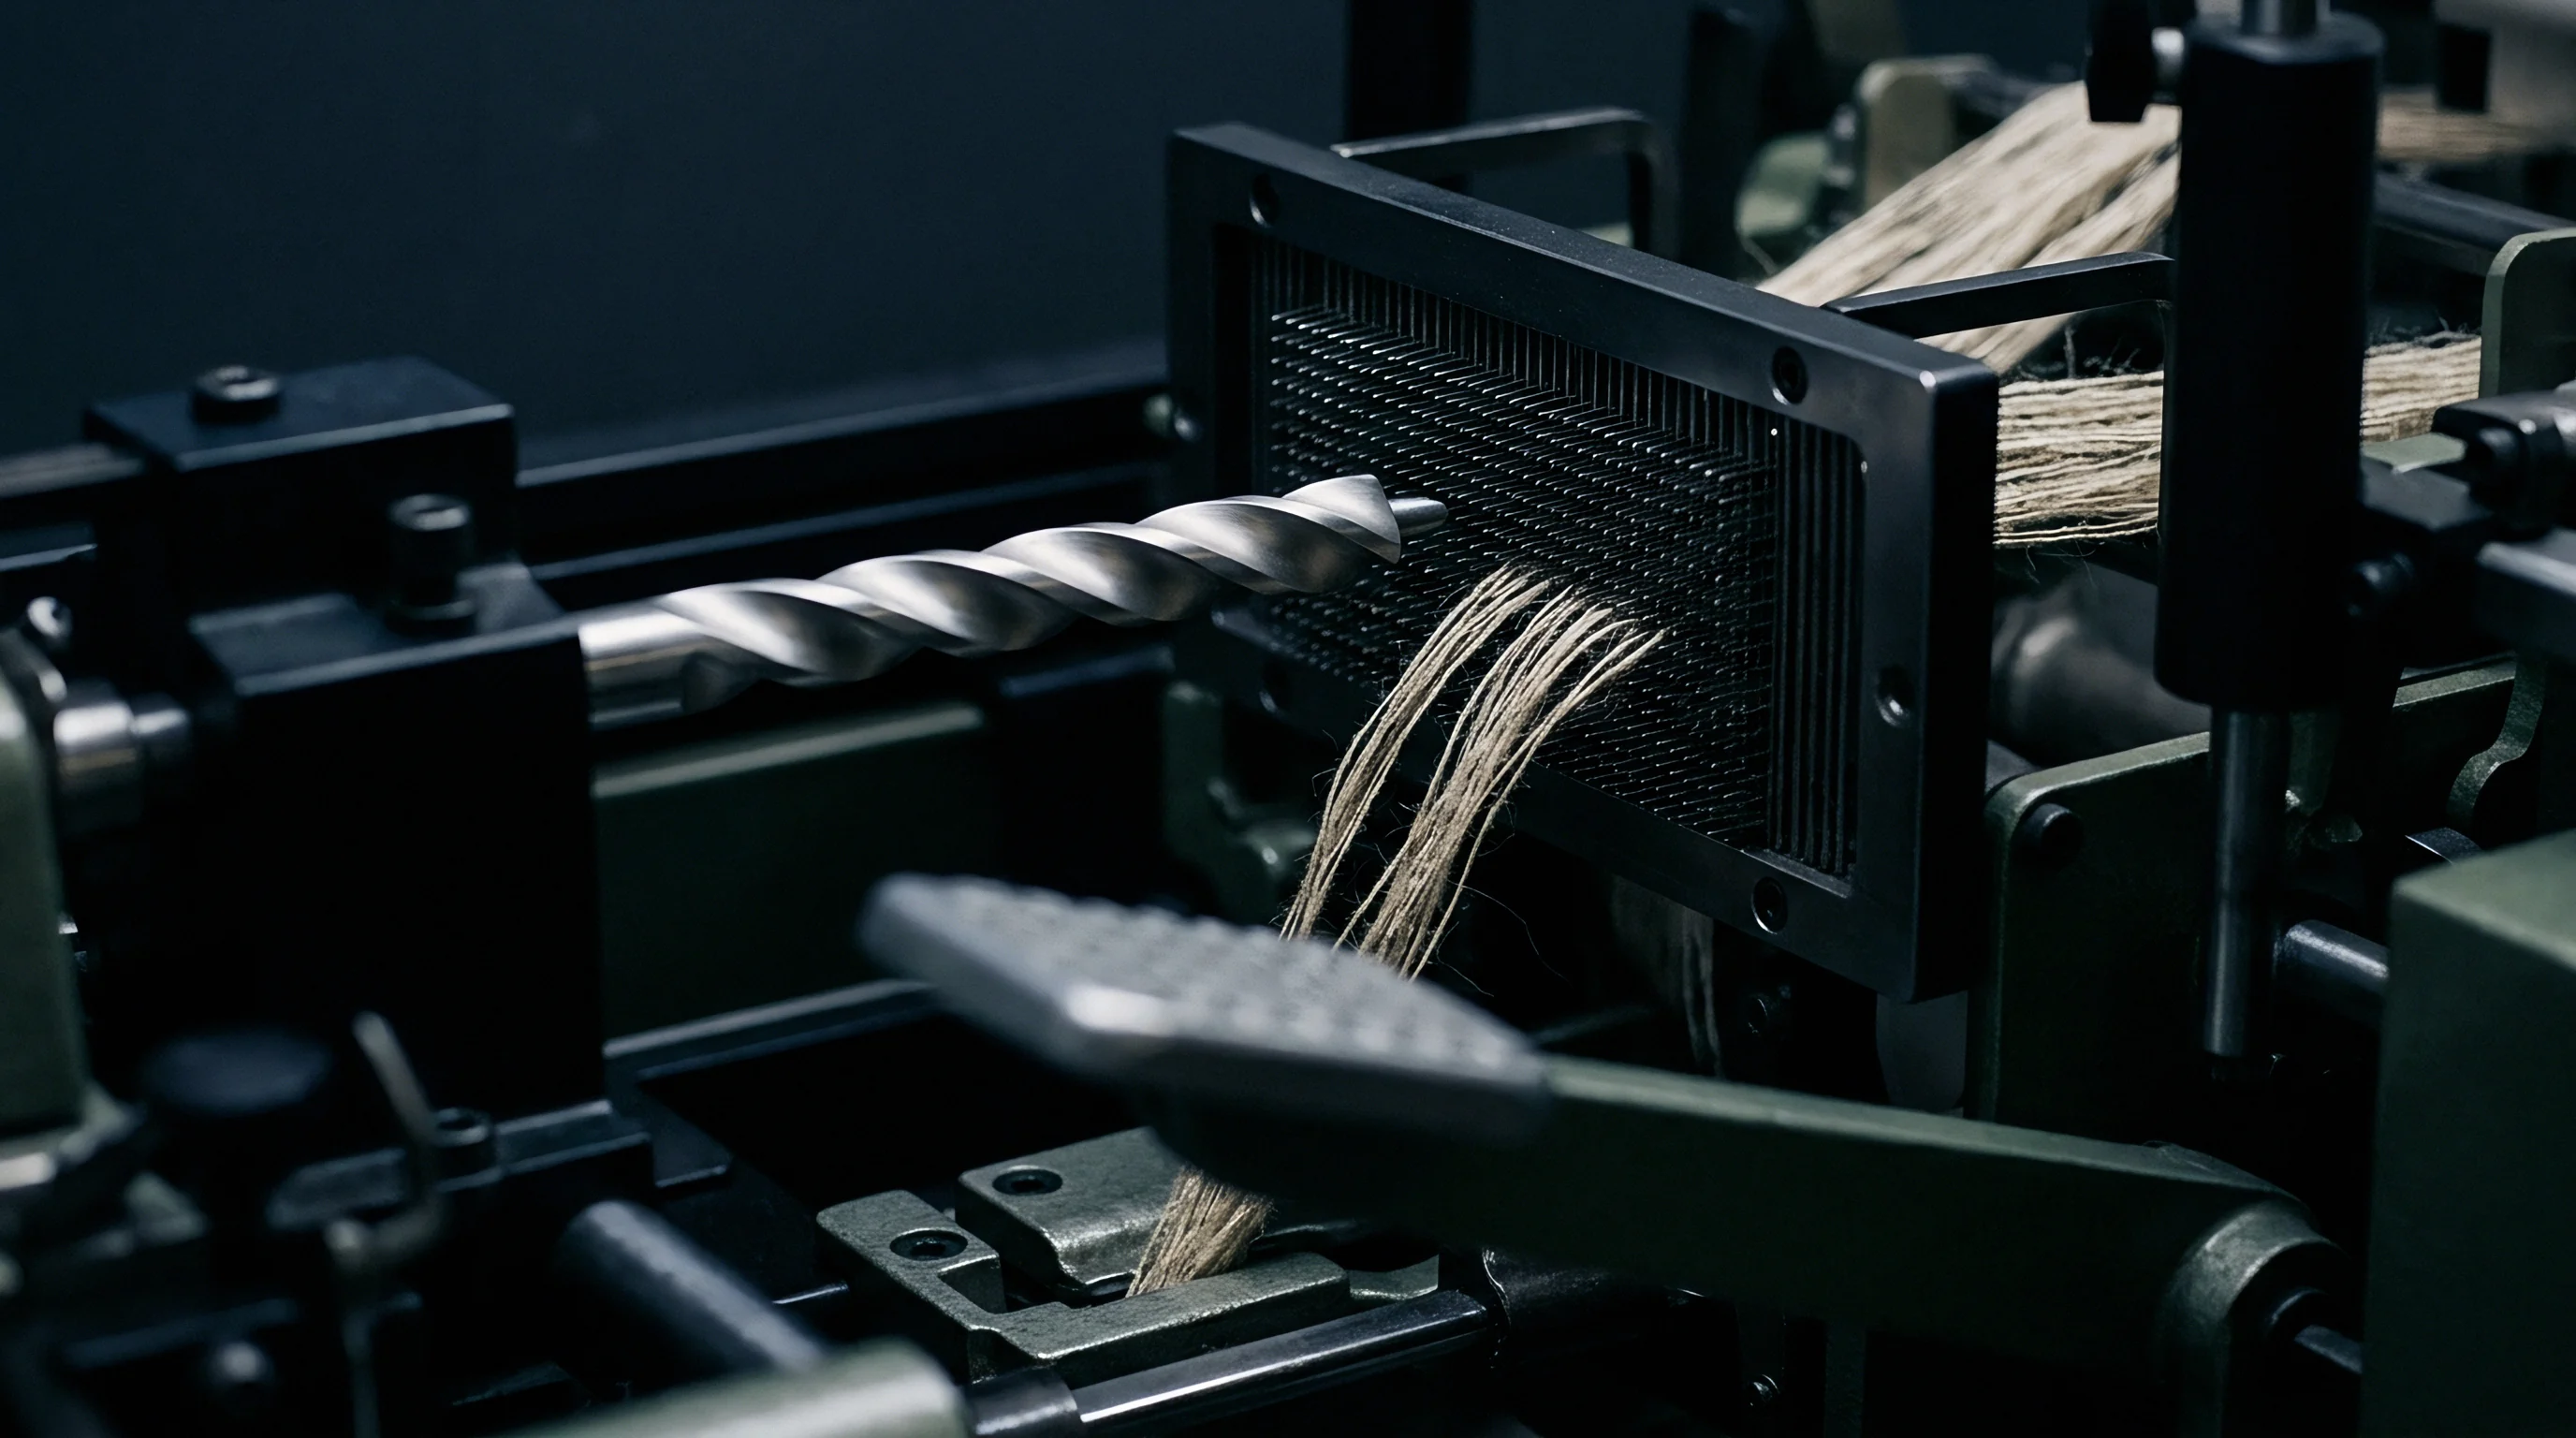
Real-Time Feature Extraction Workflows
Extracting multi-spectral image parameters within millisecond processing windows demands a distributed architecture across dedicated hardware. Field-programmable gate arrays execute low-level operations ~ including black-level correction, flat-field normalization, and spatial filtering ~ directly on raw pixel streams. Feature maps stream into dedicated graphics processors via high-speed Direct Memory Access protocols, running edge detection and contour extraction without buffering full image frames to main system memory.
Morphological parameters extracted per frame cycle define the physical quality profile of the moving sliver bundle:
- Mean Technical Bundle Width represents the mathematical average of bundle cross-sectional diameters measured across 10,000 spatial points per linear metre of sliver.
- Bundle Orientation Variance quantifies the angular deviation of fiber bundles relative to the longitudinal transport axis, measured in degrees squared.
- Shive Particle Count registers total individual lignified epidermal fragments exceeding 50 micrometres in length per linear metre of inspected sliver.
- Nep Volume Index calculates the estimated three-dimensional volume of tight fiber tangles based on optical density gradients across detected blob perimeters.
- Inter-Bundle Cohesion Index estimates physical friction potential based on surface roughness metrics and bundle contact frequency across the sliver profile.
ISO 2370 defines flax fibre fineness metrics that correlate directly with optical bundle width histograms acquired under 850 nanometer NIR illumination.
Data output rates from the feature extraction engine match the operational loop speed of industrial programmable logic controllers managing hackling comb drives. Outputting metrics every 50 milliseconds provides an updated structural profile for every 100 millimetres of moving sliver. This update frequency enables dynamic adjustments to mechanical comb parameters before the scanned sliver section enters the main pinned hackling zone.
At high transport speeds, real-time image processing distinguishes mechanical crimp damage from inherent biological variations in the fiber.


Yield
Predictive yield allocation models convert raw sliver structural metrics into dynamic mechanical control instructions for hackling machinery. Conventional hackling applies uniform comb pinning density, fixed drum speeds, and constant pin penetration depths across entire fibre lots regardless of internal structural variation. This static approach breaks fibres in coarse, highly entangled regions while under-processing fine, parallelized bundle zones.
Dynamic yield allocation continuously adjusts hackling comb parameters based on incoming optical metrics, maximizing long line fiber recovery while minimizing unwanted tow generation.
Allocation algorithms compute a real-time Hackling Severity Index derived from orientation coherence, bundle width distributions, and shive area fractions. High structural coherence and low shive content lower the required index, triggering automated comb drum speed reductions and shallow pin penetration. Conversely, coarse bundle distributions and elevated shive loads increase the index, calling for higher comb speeds and progressive pin density engagement.
Tailoring mechanical force to local sliver structure prevents delicate, fully retted bundles from snapping under comb impact, preserving staple length and boosting line yield output.

Worked Yield Optimization Scenario
Evaluating the commercial impact of predictive optical yield allocation relies on processing data from a 500-kilogram lot of dew-retted French Normandy flax sliver split into two equal 250-kilogram test runs. The baseline run passed through a conventional hackling line operating at fixed parameters: 18 pins per centimetre initial comb density, 250 revolutions per minute drum speed, and a fixed 4.0-millimetre pin penetration depth. The predictive run used the same hackling machine retrofitted with an upstream multi-spectral optical scanner linked directly to dynamic comb servo controllers.
The baseline processing run yielded 118.5 kilograms of long line fibre and 106.25 kilograms of hackling tow, with 25.25 kilograms lost as shive dust and fly waste ~ a baseline long line yield of 47.4 percent. The predictive run adjusted comb drum speeds between 180 and 280 revolutions per minute while modulating pin penetration depth from 2.0 to 5.5 millimetres based on optical feedback. It produced 136.75 kilograms of long line fibre and 89.5 kilograms of hackling tow, reducing waste to 23.75 kilograms.
Dynamic allocation raised long line yield to 54.7 percent, an absolute yield gain of 7.3 percent on identical raw material.
Downstream evaluation confirmed a corresponding improvement in long line quality. Staple length distribution analysis showed a 14 percent reduction in short fiber content below 150 millimetres in the predictively hackled stock. Mean bundle tenacity increased from 38.5 cN/tex to 42.1 cN/tex due to reduced mechanical crimp damage and lower fiber fracture rates during initial comb entry.
The economic value of the recovered fibre shifted substantially, as long line stock commanded a market price of 4.85 Euros per kilogram compared to 1.65 Euros per kilogram for hackling tow.

Dynamic Parameter Adjustment Protocol
Executing dynamic control requires an automated adjustment sequence that matches comb physics to incoming sliver properties without disturbing transport stability.
- The optical sensor captures multi-spectral image frames 350 millimetres upstream of the first hackling comb drum.
- The feature extraction engine calculates bundle width histograms, orientation coherence, and shive surface fractions within a 50-millisecond execution window.
- The allocation algorithm assigns a target Hackling Severity Index ranging from 1.0 to 10.0 for the scanned sliver segment.
- The line controller sends high-speed CANbus commands to servo-driven comb drum positioners and variable-frequency motor drives.
- Comb drum rotation speeds adjust dynamically between 150 and 320 revolutions per minute to match target comb impact velocities.
- Linear actuators modify pin penetration depth in increments of 0.1 millimetres across an operational range of 1.0 to 6.0 millimetres.
- Progressive pinned bars engage the sliver, applying precise mechanical opening forces corresponding to localized structural density.
- Downstream web sensors verify sliver web density after combing, returning feedback signals to refine predictive model calibration curves.
Excessively rapid adjustments to pin penetration cause mechanical instability in high-density slivers, leading to web tears that shut down drawing lines.
Fine flax bundles require lower comb impact velocities to prevent structural fracture along natural cell wall dislocation marks.


Spinning
Downstream spinning performance correlates directly with the structural homogeneity achieved during predictive hackling allocation. Wet-spinning frames operating at spindle speeds exceeding 7,000 revolutions per minute expose linen roving to severe tensile stresses in the hot-water drafting trough. Slivers characterized by wide bundle width distributions and residual shive particles experience localized draft failures, producing thin spots and high end breakage rates.
Predictive optical image analysis establishes the maximum achievable yarn count, measured in metric number (Nm), before raw fibre enters initial drawing frames.
Fibre bundles hackled under dynamic control maintain uniform inter-bundle cohesion during drafting. Hot water at 65 degrees Celsius softens inter-cellular pectin matrices in the drafting trough, allowing technical bundles to slide into fine elementary fibers measuring between 12 and 20 micrometres in diameter. Slivers processed without optical yield allocation carry un-opened technical bundles exceeding 50 micrometres into the spinning trough, causing irregular drafting force spikes that break the drafting ribbon.
Automated predictions lock in target spinning counts, ensuring raw material allocations match frame mechanical limits.
| Optical Feature Class | Raw Sliver Value Range | Achievable Wet-Spun Count | Target Yarn Tenacity | Spindle End Breakage Rate |
|---|---|---|---|---|
| High Coherence / Low Shive | Coherence > 0.85, Shive < 0.8% | Nm 60 to Nm 84 | 42 to 48 cN/tex | Below 1.2 per 100 Spindle Hours |
| Medium Coherence / Moderate Shive | Coherence 0.75-0.85, Shive 0.8-1.5% | Nm 39 to Nm 50 | 35 to 41 cN/tex | 1.8 to 2.5 per 100 Spindle Hours |
| Low Coherence / Elevated Shive | Coherence 0.65-0.75, Shive 1.5-2.2% | Nm 26 to Nm 36 | 28 to 34 cN/tex | 3.2 to 4.5 per 100 Spindle Hours |
| Sub-Standard Sliver Structure | Coherence < 0.65, Shive > 2.2% | Nm 9 to Nm 18 (Dry Spun) | 18 to 25 cN/tex | Exceeds 6.0 per 100 Spindle Hours |

Can Image Analysis Prevent Yarn Defect Spikes?
Undetected structural defects in raw sliver inevitably transition into high-cost yarn flaws during wet spinning. Thick places, thin places, and residual shive slubs degrade yarn appearance grades and reduce weaving efficiency on high-speed air-jet looms. Optical inspection at the hackling stage catches structural anomalies before fibers reach roving and spinning frames, allowing bad lots to be re-routed to coarse dry-spun yarn streams or blended with cotton synthetic carriers.
Downstream yarn defect modes trace directly back to un-identified sliver anomalies:
- Shive Slubs originate from epidermal bark fragments that resist drafting trough dissolution, creating dense thick points surrounded by zero-twist weak zones.
- Drafting Waves develop when high bundle width variance disrupts draft zone friction, producing periodic yarn count variations every 15 to 30 centimetres.
- Hairiness Spikes arise from fractured fiber ends produced by excessive comb impact speeds during non-optimized hackling operations.
- Tensile Dropouts occur where localized nep clusters prevent twist insertion, creating structural points of weakness that fail under warp tension.
ISO 2062 specifies tensile strength testing protocols where wet-spun linen yarns derived from predictively hackled slivers achieve tenacity values above 42 cN/tex.
Lustre in finished linen fabric depends on surface smoothness and axial alignment of elementary fibers within the yarn core. Un-hackled slivers containing coarse, twisted bundles scatter light randomly, producing a dull matte appearance in finished woven goods. Predictively hackled long line fibre creates compact, highly aligned yarn structures that reflect light uniformly, delivering high lustre values measured via standard 60-degree gloss meters.
Feeding raw sliver with high shive counts into fine wet-spinning channels increases frame end breakages, forcing frequent piecing operations that degrade yarn evenness and ruin mill operating margins.


Contract
Integrating real-time optical image analysis into commercial procurement frameworks transforms raw flax sliver valuation from subjective hand-classing to objective structural metrics. Fibre purchase contracts traditionally rely on visual inspection of scutched hand-samples, leading to extensive price disputes when delivered lot yields fail to match spinner expectations. Standardized optical sliver certificates append automated bundle width histograms, shive surface fractions, and predicted hackling yield metrics directly to commercial shipping dossiers, establishing clear quality baselines before material leaves scutching mills.
Commercial contracts incorporate yield allocation formulas that adjust landed prices based on certified optical parameters. Base prices tie to benchmark grades such as French Normandy dew-retted medium line flax. When incoming optical scans reveal higher orientation coherence and lower shive fractions than contract baselines, automatic price premiums accrue to scutchers.
Conversely, elevated nep densities or wide bundle width distributions trigger contractual price discounts or grant buyers rejection rights before bales enter hackling preparation lines.
| Quality Tier | Optical Quality Metric Range | Hackling Yield (%) | Landed Fibre Cost (€/kg) | Spinning Waste Allowance (%) | Finished Fabric Cost (€/m) |
|---|---|---|---|---|---|
| Tier 1 (Fine Wet-Spinning) | Coherence > 0.85, Shive < 0.8% | 54.7% | 4.85 | 4.2% | 3.12 |
| Tier 2 (Standard Line) | Coherence 0.75-0.85, Shive 0.8-1.5% | 48.2% | 4.20 | 6.5% | 3.45 |
| Tier 3 (Coarse Line / Tow) | Coherence 0.65-0.75, Shive 1.5-2.2% | 41.5% | 3.50 | 9.8% | 3.98 |
| Tier 4 (Off-Spec Reject) | Coherence < 0.65, Shive > 2.2% | 32.0% | 2.40 | 16.5% | 4.85 |

Yield-Adjusted Commercial Mechanics
Financial valuation models prove that raw fibre price constitutes only a fraction of total finished product costs. Low-cost raw sliver carrying sub-standard structural metrics incurs severe financial penalties through low hackling yields, high spinning waste rates, and excessive frame downtime. The total landed cost of fine linen yarn, expressed per finished linear metre of 145-centimetre wide 160 g/m² woven fabric, rises sharply when un-optimized raw material moves through preparation and spinning lines.
Determining total landed cost requires tracking waste accumulation across all processing stages from raw sliver to finished cloth. A 250-kilogram lot of Tier 1 optical quality raw sliver costing 4.85 Euros per kilogram delivers a finished fabric cost of 3.12 Euros per metre due to high long line yield (54.7 percent) and minimal spinning waste (4.2 percent). The same volume of Tier 4 sub-standard sliver purchased at a discounted price of 2.40 Euros per kilogram results in a finished fabric cost of 4.85 Euros per metre.
Low long line recovery (32.0 percent) combined with high spinning waste (16.5 percent) and low frame efficiency completely negates initial raw material savings.
Procurement agreements specify target optical parameters alongside traditional physical metrics:
Standard quality adjustment clauses in cross-border flax supply contracts mandate that if the measured mean shive surface area fraction exceeds 1.45 percent across a 5,000-kilogram shipping lot as verified by high-speed line-scan inspection, the invoice total automatically decreases by 0.12 Euros per kilogram for every 0.10 percent incremental shive increase above target baseline limits.