Calibrating Optical Diameter Distribution Metrics against Gravimetric Cut-and-Weigh Reference Standards
Optical diameter distributions overstate flax fineness due to non-circular cross-sections; calibrating against gravimetric ISO 2370 standards prevents mill spinning failures.


Scale
Gravimetric methods anchor bast fiber fineness testing directly in mass measurement. Mass offers a stable baseline unaffected by cross-sectional shape, optical refraction, or surface ellipticity. Specifying fineness for commercial bast fiber procurement relies on determining linear density ~ expressed either as metric fiber number (Nm) or direct linear density in dtex or tex.
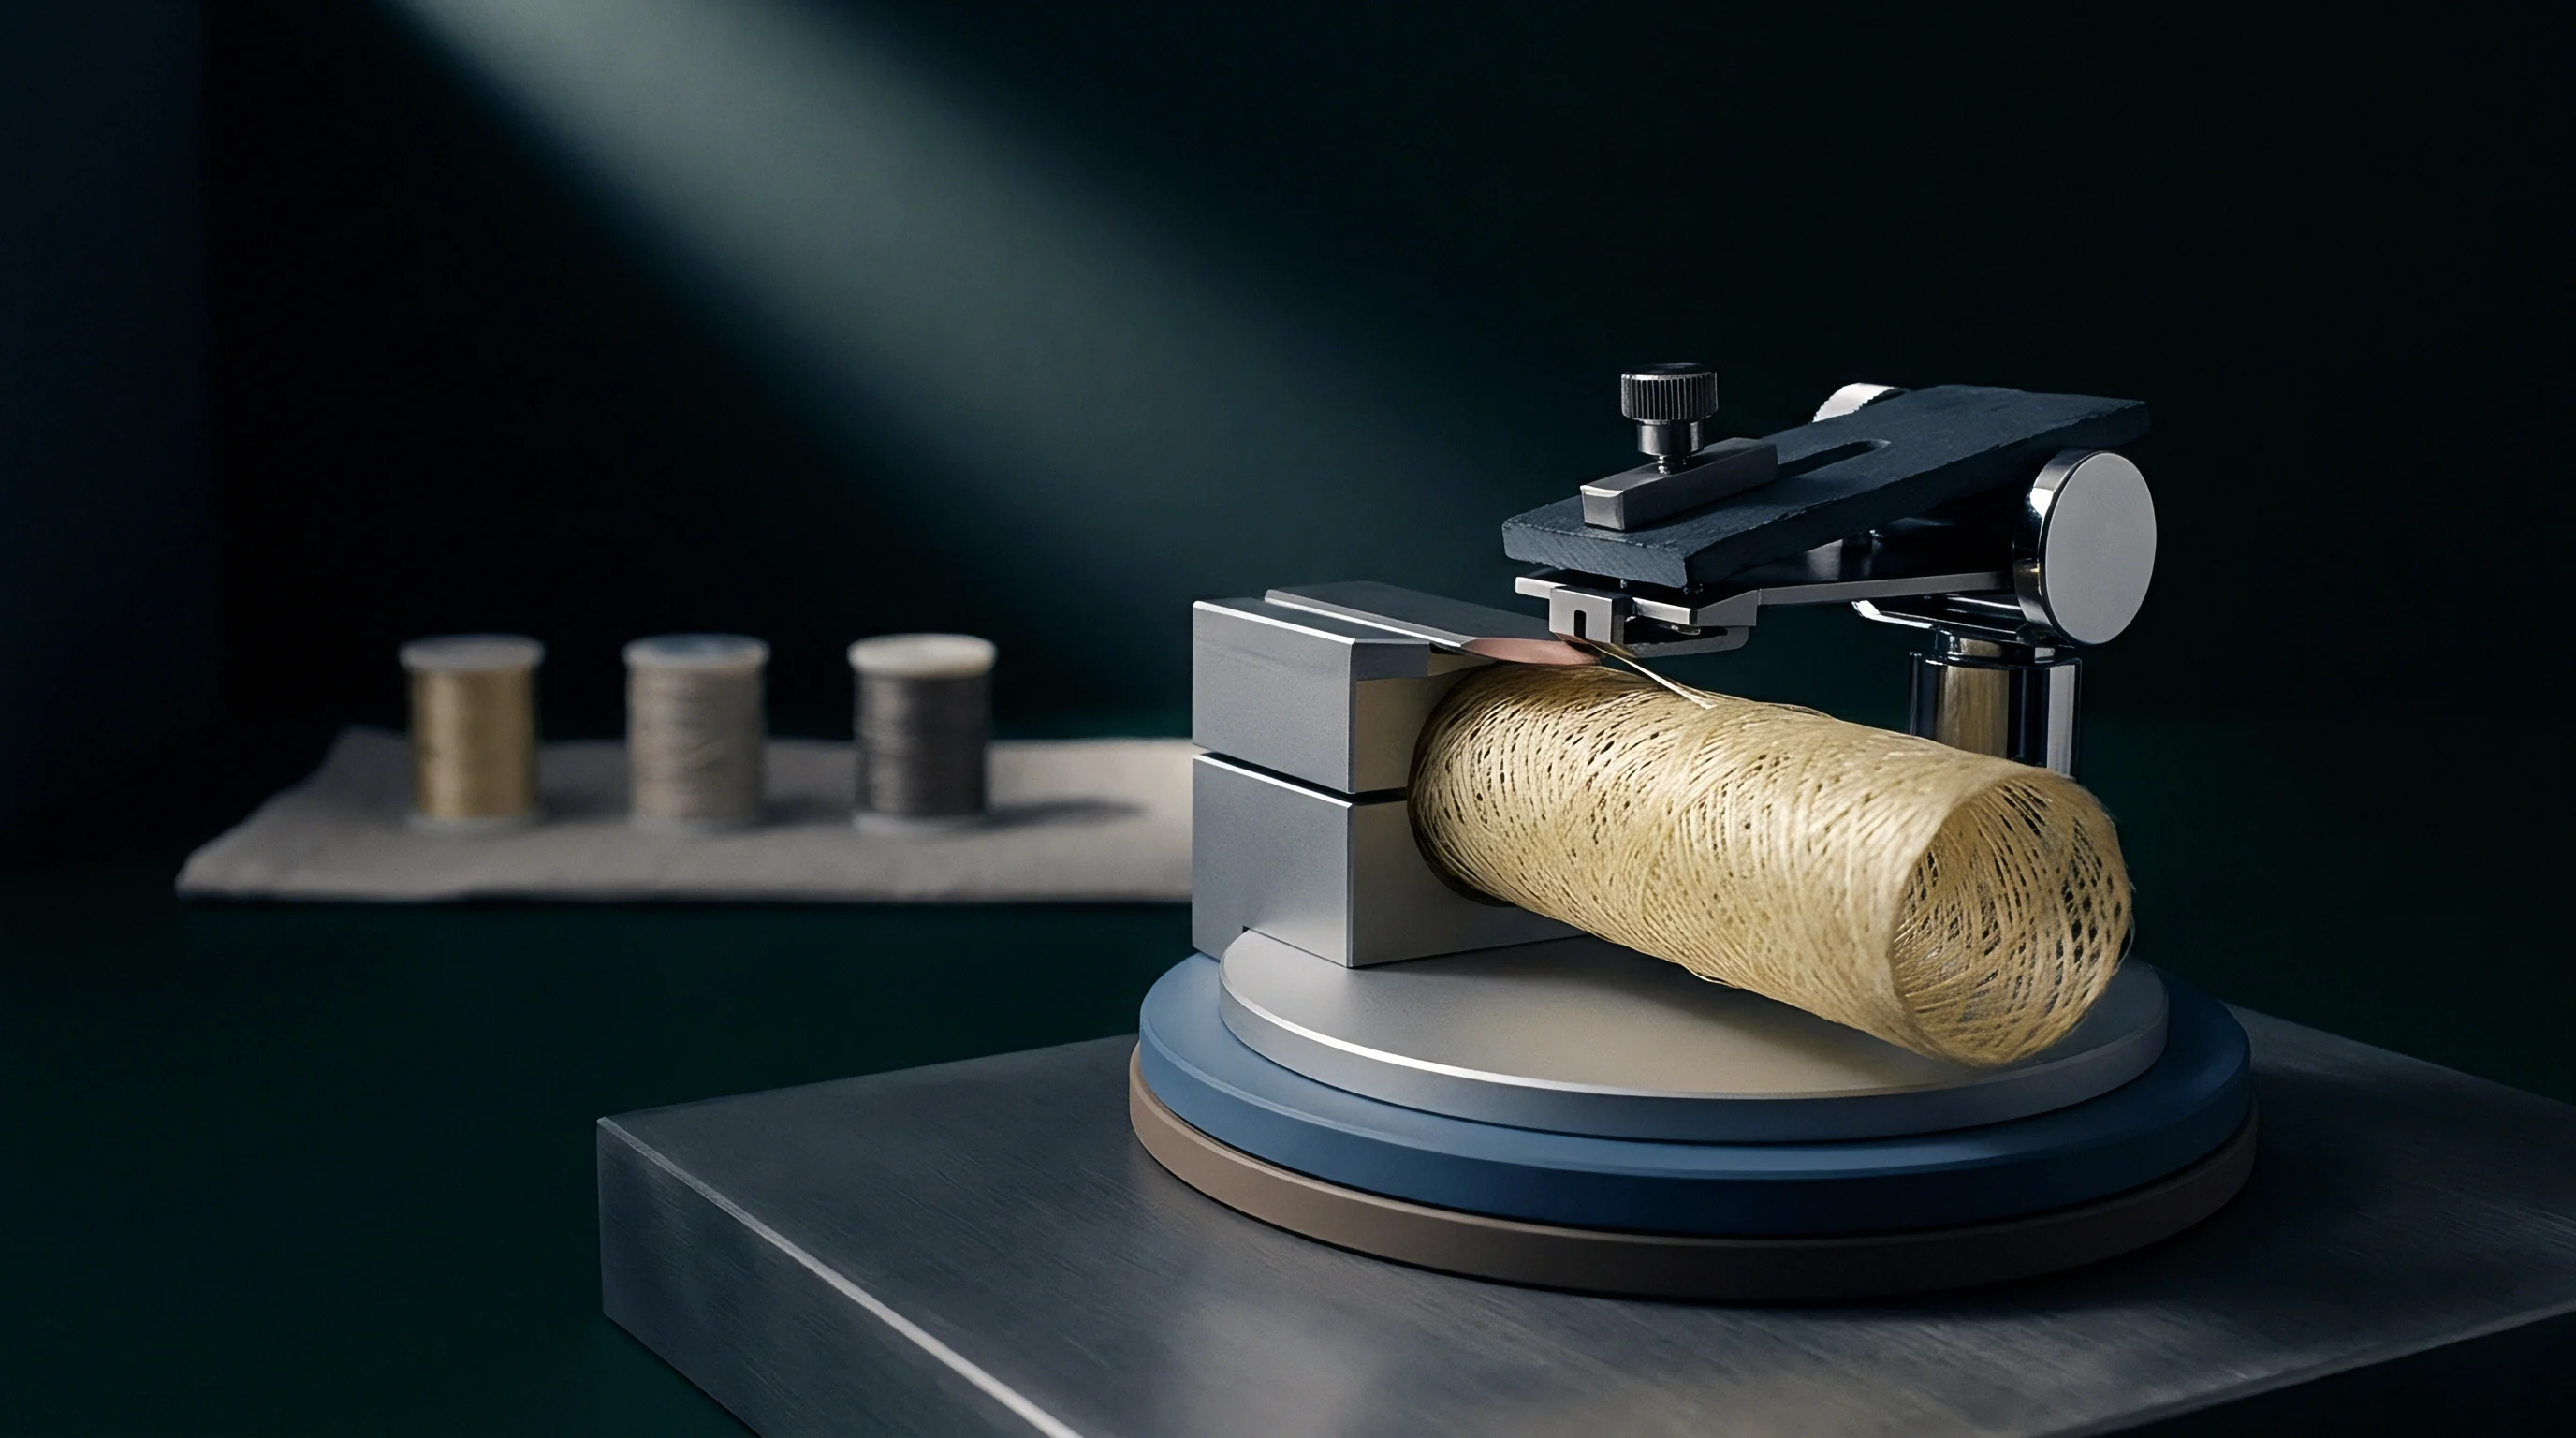
The primary reference technique cuts parallelized fiber strands to an exact calibrated length, counts the individual segments, and weighs them on an analytical balance under standard atmospheric conditions. This cut-and-weigh procedure establishes true mass per unit length, against which secondary, automated, or optical measurement systems are validated.
Flax fibers present measurement challenges that synthetic monofilaments do not. While extruded synthetics maintain uniform round cross sections, natural flax filaments exhibit variable architecture. Elementary fibers, or ultimates, feature polygonal cross sections containing central cavities called lumina.
Commercial technical fibers consist of multiple ultimates bound by a pectinous middle lamella matrix. Cut-and-weigh analysis bypasses this structural variation by measuring the aggregate mass of a set segment length. If five hundred fiber segments cut to a length of ten millimeters weigh zero point seven five milligrams, the calculated average linear density is fifteen dtex, corresponding to a metric fiber number of Nm six hundred sixty-seven.
This direct mass value serves as the reference for commercial trade and spinning yield calculations.

Gravimetric Linear Density Foundations
Primary standards calculate linear density by dividing specimen mass by length. ISO 2370 defines the reference procedure for flax fiber fineness using gravimetric cut-and-weigh protocols. Sample preparation involves combing raw or scutched flax strands until the fibers lie parallel, clearing short fibers, neps, and tangles.
The parallelized ribbon is mounted into a dual-blade cutter built for rigid axial alignment. The blade separation sets the specimen length ~ typically ten millimeters or twenty millimeters ~ held within a tolerance of plus or minus zero point zero five millimeters.
| Processing State | Cutting Length (mm) | Metric Number (Nm) | Linear Density (dtex) | Test Method |
|---|---|---|---|---|
| Scutched Line Flax | 20.0 | 250 – 450 | 22.2 – 40.0 | ISO 2370 Section 6 |
| Hackled Line Flax Slivers | 20.0 | 450 – 800 | 12.5 – 22.2 | ISO 2370 Section 6 |
| Combed Flax Tow | 10.0 | 300 – 600 | 16.7 – 33.3 | ISO 1973 Method A |
| Cottonised Degummed Flax | 10.0 | 600 – 1200 | 8.3 – 16.7 | ISO 1973 Method B |
| Values reflect standard atmospheric conditioning at 20°C and 65% relative humidity per ISO 139. | ||||
Specimen moisture content directly impacts gravimetric results. Flax fibers absorb ambient moisture up to twelve percent of their dry weight depending on relative humidity. Before weighing, samples are conditioned in an environmental chamber at twenty degrees Celsius plus or minus two degrees, and sixty-five percent relative humidity plus or minus four percent, for at least twenty-four hours.
Mass is measured on a microbalance accurate to zero point zero zero one milligrams. In evaluating bast fiber metrics, gravimetric cut-and-weigh protocols serve as the baseline for determining true linear mass.

Bundle Cutting Precision and Mass Measurement
Accuracy hinges on preparing uniform segment lengths from parallel fibers. Misalignment during cutting inflates specimen mass, producing artificially coarse fineness values. Combing must align filaments without breaking them, drawing small bundles repeatedly through fine needle beds before clamping under tension for cutting.
Cutting twenty millimeter parallel bundles from dew-retted flax at sixty-five percent relative humidity yields a gravimetric linear density precision within zero point one millitex on a microbalance.
Non-fibrous surface matter also affects mass measurements. Residual shive, natural waxes, and pectins add weight unrelated to the cellulosic fiber structure. High-precision reference protocols specify solvent extraction with petroleum ether or ethanol-toluene mixtures.
Removing surface waxes isolates the fiber mass so linear density is not artificially inflated. Skipping extraction or climate conditioning distorts calculated metric numbers, which can cause drafting failures on the spinning frame, higher end-break rates, and mispriced shipments.


Profile
Automated optical instruments record projected transverse dimensions of individual filaments suspended in liquid or moving past light sensors. Optical Fibre Diameter Analysers (OFDA) and laser scanning devices like the Sirolan Laserscan capture thousands of data points in seconds. These systems were developed for animal fibers like wool and cashmere, which feature nearly circular cross sections.
On flax, optical instruments record the projected width from a single viewing plane. Software processes these projections into calculated diameter distributions, mean fiber diameters, and coefficients of variation.
Cross-sectional geometry complicates optical evaluation of bast fiber bundles. When scanning a flattened bundle, the instrument registers the widest silhouette presented to the light beam and assumes a circular cross section, deriving area and mass from the square of that projected width. This introduces systematic bias on non-circular flax strands.
An optical reading of twenty micrometers can correspond to a linear density quite different from that of a solid wool fiber of identical measured width. Calibrating optical output against gravimetric standards requires accounting for these beam-scanning mechanics.

Optical Projection Microscopy Mechanics
Automated benchtop analyzers project focused light across separated filaments to capture silhouettes. In projection systems, fiber snippets ~ typically zero point eight to one point two millimeters long ~ are spread on a glass slide or suspended in a fluid medium. A digital camera or optical sensor records light attenuation as fibers pass through the beam, while software algorithms locate edges by detecting light intensity shifts across pixel arrays.
Edge detection sensitivity depends on optical contrast and depth of field. Flax fibers vary in translucency according to retting state and cell wall thickness. Under-retted fibers retain pectin that scatters light differently than fully degummed cellulose.
If the thresholding algorithm misinterprets semi-translucent pectin borders as fiber edges, measured widths shift accordingly. Evaluating automated optical analyzers requires examining beam path geometry and cross-sectional distortion.

Automated Image Analysis and Beam Scanning
Modern testing instruments employ linear photodiode arrays or high-resolution cameras to measure thousands of transverse profiles per minute. The system compiles a histogram of diameter distribution across fixed intervals, usually one micrometer wide. Software routines then calculate summary statistics, including mean and median diameter, standard deviation, coefficient of variation (CV), and curve skewness.
- Systematic Beam Shadowing creates phantom diameter readings when overlapping filaments pass the optical array simultaneously during automated scanning runs.
- Focal Plane Drift introduces artificial variance in edge detection calculations during high-speed laser measurement trials.
- Cross-Sectional Ellipticity skews single-angle optical width projections away from true equivalent circular area metrics.
- Debris Interferences register residual shive particles as coarse fiber outliers within automated distribution histograms.
Without bast-specific calibration routines, optical instruments systematically overestimate fiber coarseness. Equipment manufacturers maintain that their systems accurately measure projected physical dimensions, leaving the conversion from optical width to gravimetric mass to the testing laboratory’s software calibration factors.


Disparity
Discrepancies between mass-based fineness and optical dimensions stem from the cellular structure of flax strands. A gravimetric cut-and-weigh test measures true linear mass density, taking into account internal void space, cell wall density variations, and irregular shapes. Optical instruments measure single-plane projection widths and calculate cross-sectional area assuming a solid, uniform cylinder.
This difference in physical principles creates clear variance when comparing optical mean diameters to gravimetric equivalent diameters on the same flax lot.
Solid flax cellulose has a density of roughly one point five zero grams per cubic centimeter. If a flax fiber were a solid cylinder twenty micrometers in diameter, its cross-sectional area would be three hundred fourteen square micrometers, yielding a linear density of four point seven one dtex. Natural bast fibers have hollow central cavities, irregular polygonal walls, and variable aspect ratios.
A technical fiber with a projected optical width of twenty micrometers often contains an internal lumen taking up fifteen to thirty percent of its cross section, while its flattened ribbon shape presents its widest face to the sensor. Its actual solid cross-sectional area might be only two hundred square micrometers, equal to a linear density of three point zero dtex. Unaware of internal voids or cross-sectional flatness, the optical instrument records the fiber as coarser than it is.

Non-Circular Cross Sections and Lumen Void Fraction
Natural bast filaments have irregular polygonal shapes, broad major axes, and hollow centers. The ratio of major axis (width) to minor axis (thickness) ~ the ellipticity or aspect ratio ~ ranges from one point three to over two point five. On a microscope slide or in a fluid flow cell, physical orientation forces fibers to lie with their flat side parallel to the viewing plane.
As a result, optical sensors measure the major axis, recording the maximum dimension.
| Fiber Origin | Retting State | Optical Diameter (µm) | Gravimetric Equivalent Diameter (µm) | Shape Factor Variance (%) |
|---|---|---|---|---|
| French Dew-Retted Line | Optimal Green-Dew | 21.4 | 17.2 | + 24.4 |
| Belgian Water-Retted Line | Full Uniform Ret | 18.8 | 15.9 | + 18.2 |
| Chinese Dew-Retted Tow | Under-Retted Coarse | 26.5 | 20.1 | + 31.8 |
| Enzyme-Treated Degummed | Fully Splitting Ultimate | 14.2 | 12.8 | + 10.9 |
The lumen void adds further divergence. As the plant grows, cellulose deposits concentrically in the primary and secondary cell walls, leaving a channel through the center of the ultimate fiber. In dry, processed flax, this canal is hollow or collapsed.
Gravimetric cut-and-weigh measurements record only solid cellulosic material, reflecting true fiber mass. Optical instruments treat the entire bounding envelope ~ void included ~ as solid. This leads optical systems to overestimate mass-equivalent fiber diameters by fifteen to thirty percent, depending on maturity, retting depth, and mechanical processing.
Polygonal cross-sectional geometry in technical flax filaments causes optical beam analyzers to overstate equivalent circular diameter by up to twenty-two percent.

Technical Bundle Splitting versus Ultimate Fibre Measurement
Commercial line flax consists of composite strand structures held together by intercellular pectin matrices. Mechanical hackling and carding break these technical bundles down into finer sub-units. How far this division goes depends on retting thoroughness and drafting force.
Gravimetric tests measure the average linear density of whatever bundle mixture is present in the combed sample.
Optical analyzers process snippets that undergo fluid dispersion or air agitation during sample preparation. This high-shear environment can split fragile technical bundles into smaller units or individual ultimates. The instrument may then measure a fiber population with a higher proportion of fine filaments than exists in the bulk sliver at the spinning frame.
At the same time, unopened bundle ends present wide silhouettes that skew the coarse tail of the distribution curve. These discrepancies complicate spinning projections and commercial contracts. Which structural factors dictate whether a given flax lot needs a simple shape factor adjustment or full calibration curve recalibration remains a subject of discussion in bast fiber testing.


Correction
Reconciling optical width distributions with true mass density requires clear transformation models. Direct optical width readings cannot predict yarn spinning performance without correction factors for non-circular cross sections, lumen voids, and fiber density. Calibration algorithms must map measured optical parameters ~ mean projected diameter, variance, and skewness ~ onto the gravimetric linear density determined by ISO 2370 reference methods.
Developing a mathematical transformation requires defining a bast-specific shape factor, designated as k. This factor expresses the ratio of projected optical diameter (dopt) to gravimetric equivalent circular diameter (dgrav). The gravimetric equivalent diameter represents a solid, circular fiber with identical mass per unit length and material density.
By establishing k across different flax grades, optical instruments can convert raw image data into gravimetric-equivalent metrics for spinning calculations.

Which Optical Shape Factors Resolve Non-Circular Bast Cross-Sections?
Applying a cross-sectional shape factor adjusts raw optical calculations to match physical mass. The gravimetric equivalent circular diameter is calculated using solid cellulose density (ρ = 1.50 g/cm3) and measured linear density (Tt in dtex):
dgrav = sqrtfrac4 · Ttπ · ρ · 10-1
For a fiber with a linear density of twenty dtex, the solid equivalent circular diameter equals thirteen point zero micrometers. If an optical instrument records a mean projected diameter (dopt) of sixteen point five micrometers for this sample, the empirical shape factor k is calculated as:
k = fracdoptdgrav = frac16.513.0 = 1.27
Inter-laboratory testing establishes a correction factor of one point two two for wet-spun line flax bundles. This factor scales down raw optical diameter distribution curves to align digital metrics with gravimetric mass balances.
Adjusting optical calibration algorithms to match gravimetric mass density prevents overestimating yarn spinnability during mill qualification.
Standardizing calibration requires adhering to sequential preparation routines before running optical measurements.
- Condition the harvested flax strand sample inside a standardized testing climate at twenty degrees Celsius and sixty-five percent relative humidity for twenty-four hours.
- Align individual bast technical bundles manually using a fine steel comb until all residual kink and fiber cross-overs are completely removed.
- Mount the straightened fiber ribbon into a dual-blade precision guillotine set to an exact cutting length of ten millimeters.
- Count precisely five hundred cut fiber segments under a magnifying array to establish an accurate numerical specimen set.
- Weigh the prepared segment bundle on an analytical microbalance calibrated to an uncertainty of one microgram.
- Calculate the true mass linear density by dividing total dry weight by aggregate cumulative fiber length.

Mathematical Regression Models for Metric Conversion
Empirical transformation functions map measured optical width distributions to gravimetric metric fiber numbers. Simple linear scaling factors do not account for distribution skewness, since coarse technical bundles have higher ellipticity and larger lumen fractions than fine elementary fibers. As a result, shape factor k increases non-linearly as fiber diameter grows.
Non-linear regression models use distribution variance to refine metric conversions, applying second-order polynomial equations or Weibull transformation functions to raw optical datasets:
Nmcalc = C1 · left( dopt right)-2 · left -1
Where C1 and C2 are empirical constants derived by regressing optical distribution outputs against gravimetric ISO 2370 test results across standard reference sets. Incorporating the coefficient of variation (CVopt) corrects for distribution asymmetry, so sample lots with high proportions of coarse, unopened bundles receive an appropriate mass penalty. As flax fiber bundling increases, the optical shape correction factor must expand to prevent overestimating final yarn count capability.

Verification
Ensuring inter-laboratory reproducibility requires standardized round-robin calibration routines. Independent testing laboratories often produce divergent optical readings on identical flax lots unless instruments undergo synchronized reference alignment. Calibration establishes traceability to primary gravimetric standards, eliminating systematic bias from optical sensor drift, light source degradation, or software threshold shifts.
Commercial sourcing contracts require consistent data between buyer and seller laboratories. Verification programs distribute standardized bast reference tops ~ benchmarked by gravimetric testing ~ across participating facilities. When an optical analyzer aligns consistently with certified gravimetric values on control samples, its distribution output can be accepted for lot qualification and pricing.

Inter-Laboratory Calibration round Robin Protocols
Round-robin programs distribute identical reference tops across multiple facilities to measure testing variance. Organizers prepare uniform flax sliver tops, split them into representative sub-samples, and send them to participating laboratories for blind testing. Each facility performs both gravimetric cut-and-weigh tests per ISO 2370 and automated optical distribution scans.
| Test Method | Parameter Measured | Acceptable Intra-Lab CV (%) | Inter-Lab Variance Limit (%) | Primary Reference Standard |
|---|---|---|---|---|
| ISO 2370 Gravimetric | Metric Number (Nm) | 2.5 | 4.0 | Analytical Microbalance |
| OFDA 2000 / 4000 Optical | Mean Diameter (µm) | 1.8 | 3.5 | Gravimetric Bast Calibration Top |
| Sirolan Laserscan | Mean Width (µm) | 2.0 | 3.8 | Gravimetric Bast Calibration Top |
| Image Analysis Projection | Cross-Sectional Area (µm²) | 3.2 | 5.5 | Calibrated Stage Micrometer |
Statistical evaluation of round-robin data separates instrument bias from operator technique. If a laboratory’s optical instrument records a mean fiber diameter exceeding two standard deviations from the global gravimetric reference mean, its software calibration offsets need adjustment. Regular proficiency testing helps laboratories maintain measurement equivalence across international markets.

Reference Standards Alignment for ISO Compliance
Formal compliance requires direct traceability to certified cut-and-weigh procedures. Standards organizations mandate that secondary optical measurement systems undergo periodic recalibration against primary gravimetric reference samples across the commercial fineness spectrum, from coarse tow flax (Nm two hundred) to fine wet-spun line flax (Nm eight hundred).
Verification documentation is a required component of commercial laboratory accreditation under ISO/IEC 17025 protocols.
- Standardized Conditioning Logs verifying environmental temperature and relative humidity stability throughout the testing window.
- Instrument Optical Calibration Curves demonstrating recent validation against certified gravimetric fiber cut-and-weigh reference sets.
- Raw Diameter Distribution Histograms detailing coefficient of variation and skewness parameters alongside mean numerical output.
- Commercial Moisture Adjustment Factors detailing calculated dry mass conversions applied to incoming lot delivery invoices.
Standard purchasing contracts incorporate explicit arbitration clauses regarding technical discrepancies: In cases of dimensional dispute, gravimetric metric number determinations conducted strictly in accordance with ISO 2370 shall supersede automated optical diameter distribution metrics, and invoice adjustments shall be calculated based on gravimetric mass deficit.

Allowance
Fiber fineness figures dictate commercial valuation and downstream spinning limits in bast fiber trading. In linen manufacturing, fineness dictates the minimum number of individual fibers needed in a yarn cross section for stable ring spinning. Fine wet-spun yarns, such as Lea sixty or Lea eighty (corresponding to metric yarn counts Nm one hundred and Nm one hundred thirty-five), require slivers made of highly divided technical bundles.
If a buyer purchases a flax lot based on uncalibrated optical diameter metrics that understate true gravimetric linear density, the material can fail during drafting, causing high end-breakage rates, excess waste, and financial loss.
A flax lot delivered at an actual linear density of twenty dtex when specified at sixteen dtex cannot reach the target yarn count. The mill has to reallocate the coarse fiber to heavier yarn numbers, reducing financial yield per kilogram of processed material. Aligning optical metrics with gravimetric reference standards protects the buyer’s spinning parameters while giving the seller a verifiable valuation metric.

Translating Fibre Fineness Metrics into Yarn Count Limits
Spinnable yarn counts depend on the average number of individual filaments present in a thread cross section. Industrial wet-spinning guidelines establish that stable yarn formation requires a minimum of thirty to thirty-five fibers in the cross section during drafting. For dry-spinning tow operations, where unevenness tolerances are wider, the minimum limit drops to twenty-five to thirty filaments.
Calculating the maximum spinnable yarn count (Nmyarn) from fiber metric fineness (Nmfiber) relies on the cross-sectional fiber population constraint (Nmin):
Nmyarn = fracNmfiberNmin
If an uncalibrated optical instrument overstates fiber fineness ~ reporting an Nm of eight hundred (12.5 dtex) when true gravimetric mass evaluation yields an Nm of six hundred (16.7 dtex) ~ the mill projects an unattainable yarn limit. Assuming Nmin = 35, theoretical spinnability reaches metric yarn count Nm twenty-two point eight (Lea forty-two). When loaded onto the spinning frame, the coarse fiber (true Nm six hundred) provides only twenty-six fibers in the cross section at Nm twenty-two point eight, triggering repeated drafting breaks.
Correcting optical metrics to match gravimetric values prevents these processing errors.

Commercial Sourcing Specifications and Price Valuation
Raw material supply agreements rely on explicit contractual terms governing fineness tolerances and weight adjustments. Fine hackled line flax slivers command higher prices per metric ton than coarse tow fibers. When purchasing high-grade line flax, procurement contracts establish fineness thresholds with tiered price adjustments for non-conforming shipments.
Commercial purchasing contracts frequently integrate dual-method verification. Sourcing specifications require vendors to supply OFDA or Laserscan diameter distribution curves for rapid lot screening, backed by certified ISO 2370 gravimetric cut-and-weigh test reports for batch lots exceeding five metric tons. Fineness tolerance clauses define acceptable variance bands ~ typically permitting a plus or minus three percent deviation from target Nm before triggering price renegotiation or lot rejection.
Commercial valuation models link fiber metric fineness directly to the landed cost per finished meter of woven cloth, as fine bast fibers yielding lightweight, high-density fabrics command higher wholesale prices per square meter. Establishing clear mathematical calibration between rapid optical diameter screening and gravimetric reference standards protects material performance, reduces spinning downtime, and ensures raw flax purchases reflect verifiable physical value.