Optimizing High Density Linen Weaving Efficiency through Basic Operator Allocation Frameworks
Adjusting weaver loom allocations based on high-density flax warp end-break rates maximizes loom-hour output and prevents stop-mark quality losses.

Density
Wet-spun linen yarns exhibit high tensile stiffness and low elastic recovery under the cyclic beat-up stresses of modern rapier looms. As warp and weft counts per centimetre increase, the available shed opening narrows, escalating friction between adjacent flax ends during harness separation. In high-density constructions using fine wet-spun yarns, warp end breakage rates scale exponentially with higher insertion speeds rather than in direct linear proportion.
Accounting for this mechanical response is essential when setting realistic loom allocation frameworks in linen weaving sheds.
Yarn Structure and Break Kinetics
Flax fibres harvested from bast stems exhibit high molecular orientation, achieving ultimate tensile strength values up to 80 centinewtons per tex. Wet spinning aligns these ultimate fibres into dense, smooth yarns with low twist factors, typically in the 40 to 50 Lea count range for high-density household and apparel fabrics. Elastic elongation remains constrained below 2.5 percent before structural cleavage occurs.
During beat-up, the reed forces the inserted weft yarn into the fabric fell against substantial warp resistance. In constructions exceeding 24 ends per centimetre using 40 Lea wet-spun linen, clearance between adjacent warp ends inside the reed dent drops below 0.15 millimetres. This tight margin accelerates yarn-to-yarn abrasion during shedding, stripping surface sizing materials and generating fiber slubs that catch in the drop wires.
Warp end-break rates exceeding 5.5 stops per 100,000 picks at 85 percent relative humidity trigger an exponential loss in loom shed capacity.
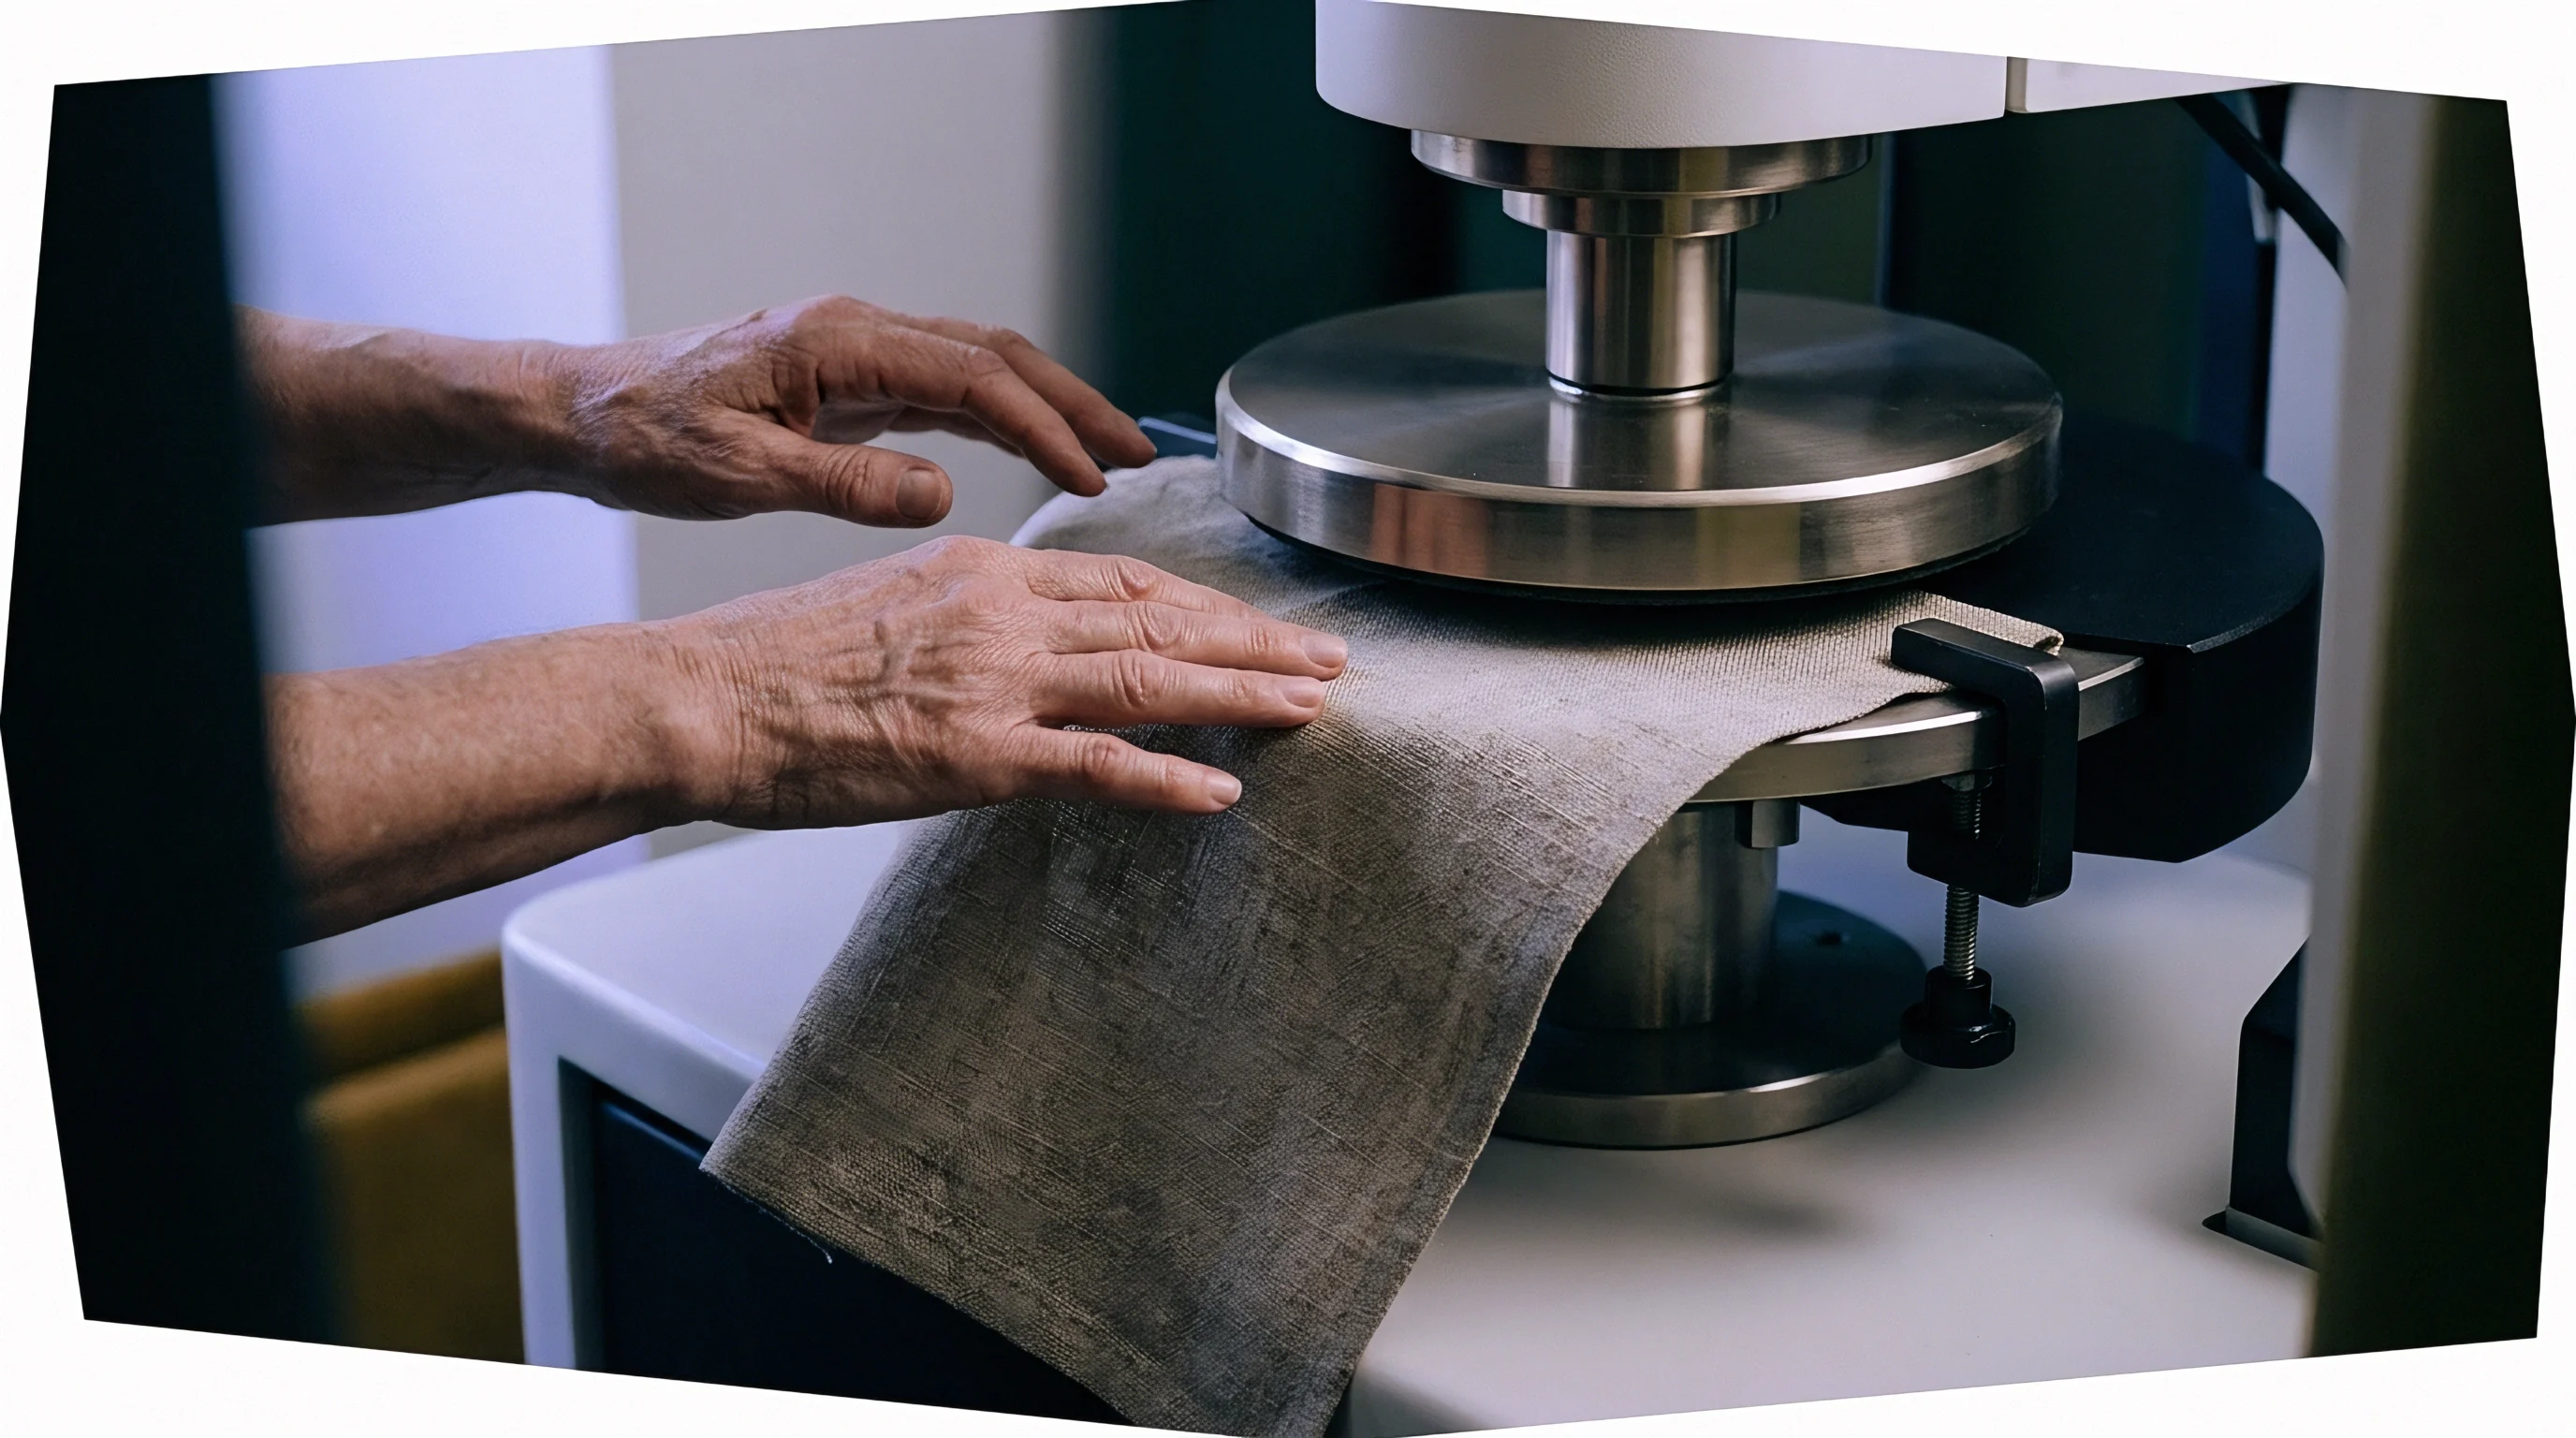
Cyclic fatigue from shedding induces micro-fractures within the flax yarn bundle. Tensile testing under ISO 2062 confirms that yarn tenacity falls by 12 to 18 percent after experiencing 5,000 tension cycles at 15 percent strain. Consequently, most warp breaks cluster in the front zone between the harness frames and the fabric fell, where tension peaks reach up to 45 grams per individual end during beat-up.

Cover Factor Limits in Heavy Flax Constructions
Standard warp sett calculations based on Peirce geometry break down when applied to wet-spun flax yarns owing to their non-circular cross-section. Flax strands flatten under beat-up pressure, shifting the effective cover factor threshold. On high-speed rapier looms, the upper cover factor limit for stable weaving rests at approximately 28 in warp and 24 in weft using the fractional cover system derived from yarn diameter and thread spacing.
Exceeding these structural limits causes continuous false drop-wire stoppages as warp ends cling together. Dense warps demand higher sizing pickup rates, often between 10 and 14 percent by weight of dry yarn, using modified starch combined with synthetic lubricants to negotiate the reed without excessive abrasion.
When warp density surpasses 85 percent of maximum theoretical cover, thread friction generates high static charges even when ambient humidification holds shed relative humidity at 75 to 80 percent. Dropping loom speed from 500 to 420 picks per minute lowers peak warp strain by 14 percent, decreasing break frequency and yielding a net increase in running efficiency across multi-loom operator sets.
Output declines often stem from uncorrected shed tension settings rather than natural crop variance across European flax harvests.


Knot
Operator efficiency during warp stoppages directly governs overall shed output in high-density linen weaving. Every loom stoppage requires a series of physical interventions to restore yarn continuity and restart insertion. The duration of each intervention depends on thread visibility, yarn count, operator skill, and harness drawing complexity.

Elements of Weaver Intervention Cycles
A complete machine stop cycle begins the instant a drop wire contacts the contact bar upon thread tension loss. The operator must identify the stopped loom, locate the broken thread in the warp sheet, piece the break, and re-engage the machine drive. Standard time study protocols partition weaver interventions into distinct work content elements to measure benchmark cycle times across high-density linen sheds.
- Warp End Piecing involves locating the broken thread on the harness beam and tying a weaver knot that glides through the reed dent without snagging.
- Heddle Threading demands drawing the pieced strand through its designated drop wire and harness eye, preventing crossed warp threads across the shed opening.
- Reed Denting requires slotting the pieced end through the correct reed split; skipping a dent alters local yarn density and creates longitudinal streaks in the gray cloth.
- Loom Restart Execution entails manually aligning the fell line before engaging the main drive motor, avoiding thick and thin bands across the fabric width.
The average time required to complete a single warp break repair on a 220-centimetre rapier loom running 40 Lea linen stands at 48 seconds for an experienced weaver. Weft break repairs proceed faster, averaging 18 seconds per occurrence, provided the automatic weft repair system successfully presents the package end to the feeder clamp.
When warp break rates exceed 4 stops per loom-hour, operator intervention times expand by 25 to 35 percent as cumulative physical fatigue and visual strain set in.
Faulty end-joining techniques during high-speed rapier operation cause immediate re-breakage upon warp line tensioning, compounding downtime across adjacent looms.

Allocation
Assigning machine loads to weaving operators relies on balancing machine stop rates against operator repair cycle durations. High-density linen looms exhibit unpredictable stoppage clustering because thread break events are correlated through localized tension spikes across the warp beam. Conventional deterministic allocation models miscalculate lost machine hours under these high-density weaving dynamics.

Can Allocation Formulas Account for Non-Linear Warp Stoppages?
Traditional Ashcroft capacity models assume a constant Poisson arrival rate for thread breakage across the loom shed. In high-density flax weaving, thread breakage rates fluctuate significantly as the warp beam unwinds from full diameter to core, driven by varying warp alignment angles and beam tension buildup. Applying static allocation ratios leads to weaver interference, a state where multiple looms sit idle simultaneously awaiting operator service.
Weaver interference inflates lost machine hours sharply whenever an operator oversees more looms than the mean breakage rate permits. The Ashcroft efficiency formula incorporates an interference factor based on the ratio of operator servicing time to total machine running cycle time. Applying this mathematical framework allows production planners to construct capacity curves tailored to specific linen yarn quality grades.
| Looms per Weaver | Warp Stops per Loom-Hour | Operator Servicing Ratio (%) | Interference Loss (%) | Net Loom Shed Efficiency (%) |
|---|---|---|---|---|
| 4 | 2.5 | 3.33 | 1.2 | 91.5 |
| 6 | 2.5 | 5.00 | 2.8 | 88.4 |
| 8 | 2.5 | 6.67 | 5.1 | 84.2 |
| 4 | 5.0 | 6.67 | 4.8 | 84.5 |
| 6 | 5.0 | 10.00 | 10.4 | 76.2 |
| 8 | 5.0 | 13.33 | 18.2 | 65.1 |
Data recorded across multiple production shifts running 200 centimetre reed-width looms demonstrates that increasing weaver load from 4 to 8 machines under a 5.0 stop per hour regime reduces overall shed efficiency from 84.5 percent to 65.1 percent. Due to severe interference losses, total cloth output across eight looms under the lower allocation ratio actually surpasses total output under the higher machine assignment.

Mathematical Frameworks for Machinery Assignment
Determining the optimal number of looms per worker requires modeling the interplay between random machine stops and operator service times. Production planners employ a standardized analytical sequence to establish baseline allocation limits for high-density linen styles.
- Calculate base warp break frequency per 100,000 picks using recorded electronic loom stop log data over forty-eight machine operating hours.
- Measure average operator intervention cycle duration, including walk time, end-location time, knotting speed, and loom restart calibration.
- Determine total machine idle time per hour by applying Ashcroft queueing factors against the calculated operator servicing ratio.
- Adjust assigned machine count per weaver until overall shed efficiency reaches the target operational equilibrium.
ASTM D5430 four-point scoring assigns maximum penalty points to start-up marks generated when idle looms dwell over forty seconds under high tension.
Dynamic redistribution of operator assignments during shifts accounts for temporary yarn quality drops or humidity variations in the weaving shed. When sensors detect a cluster of stoppages on a specific beam, neighboring operators absorb adjacent machines to keep target idle times within defined bounds.
Master supply agreements specifying minimum loom efficiency targets of eighty percent require explicit adjustments to weaver assignments whenever warp end-break rates exceed four stops per loom-hour.


Patrol
Floor layout and movement pathways determine how fast an operator arrives at a stopped machine after a stop signal activates. In high-density linen weaving sheds, transit time accounts for a substantial fraction of total machine downtime. Designing floor layouts that minimize walking distance while maintaining clear visual lines directly improves loom running efficiency without increasing staffing levels.

Spatial Geography and Walking Speeds
Operator transit time represents up to forty percent of total loom downtime in sheds running high-density linen constructions. An operator walking at a standard pace of 1.2 metres per second covers 60 metres in 50 seconds, a duration equal to the time needed to repair an entire warp break. Physical aisle configurations directly dictate whether transit times optimize or degrade machine utilization rates.
Straight-line machine placements arranged back-to-back allow weavers to monitor two rows of looms simultaneously while walking a single central aisle. High-density looms equipped with top-mounted LED signal towers reduce operator stop detection latency by providing unambiguous visual indicators across long sightlines.
| Layout Type | Machine Cluster Count | Average Walk Distance per Stop (m) | Mean Detection Delay (s) | Aisle Efficiency Factor |
|---|---|---|---|---|
| Single In-Line Row | 6 | 18.5 | 12.0 | 0.82 |
| Dual Back-to-Back Rows | 8 | 8.2 | 4.5 | 0.94 |
| U-Shape Quadrant Cluster | 8 | 6.4 | 3.1 | 0.97 |
| Perpendicular Grid | 10 | 24.1 | 16.8 | 0.74 |
Cluster arrangements placing looms in U-shaped quadrants yield the shortest average walk distances per stoppage event. Placing high-density warps within compact walking loops allows operators to respond to stop indications within 5 seconds of signal activation, minimizing loom dwell times under high static tension.

Intervention Latency and Stop Detection
Optical stop indicators mounted on top of the loom frame signal thread breakage immediately to the surrounding shed floor. Stop signal response latency drops significantly when visual indicators operate without physical obstructions like yarn creels or beam staging racks. Positioning high-break warps along direct sightlines reduces operator detection latency faster than adding automated stop indicator lamps.
Selecting appropriate spatial allocation parameters guides floor design for high-density flax production environments.
- Loom Cluster Proximity dictates total distance walked per operator cycle. Grouping adjacent high-density frames reduces unproductive transit time across the floor.
- Visual Sightline Clearance allows an operator to detect signal lamps from any point in the assigned aisle, decreasing stop motion response delay.
- Aisle Width Allocation provides space for material handling carts and beam transport equipment. Narrow pathways restrict movement and slow down package replenishment.
- Warp Beam Replacement Staging aligns material delivery schedules with forecasted loom run-out times. Pre-staged beams eliminate operator waiting periods during cloth roll doffing.
Integrating floor routing plans with electronic loom monitoring software allows supervisors to track real-time operator locations against machine stoppage logs. Analyzing this spatial data highlights bottlenecks in operator movement, enabling continuous optimization of aisle boundaries.
Grouping high-density warps within a single continuous aisle minimizes weaver travel delay and maintains consistent shed tension monitoring.


Costing
Financial performance in high-density linen manufacturing depends on minimizing total variable expenses per unit of output. Machine downtime converts directly into unabsorbed fixed overheads, while frequent stoppages create cloth defects that reduce landed fabric prices. Optimizing operator allocations balances labor expenditure against loom-hour overhead absorption to achieve the lowest landed cost per linear metre of finished linen fabric.
Financial Consequences of Stoppage Marks
Starting marks and set-off blemishes generated during prolonged loom stoppages reduce the commercial value of woven linen fabrics. When a loom stops under high warp tension, flax fibers undergo stress relaxation, altering yarn crimp at the fabric fell line. Restarting the machine without precise fell-line compensation produces a visible thick or thin bar across the warp width.
Fabric quality grading standard ASTM D5430 evaluates gray and finished cloth using a four-point penalty system. Stoppage marks exceeding 230 millimetres in length earn a maximum 4-point penalty. Accumulating more than 28 penalty points per 100 square metres reclassifies premium first-quality linen goods to second-quality status, resulting in a 30 to 45 percent price discount at wholesale settlement.
Loom downtime overhead scales directly with yarn count density due to cumulative warp end repair times.
Excessive machine idle time caused by poor weaver allocations increases defect rates beyond acceptable grade thresholds, destroying profit margins on high-density weaving contracts.

Worked Example of Metre Cost Optimization
Consider a production run producing 100 percent wet-spun linen plain weave at 220 centimetres reed width, using a 36 Lea warp and 30 Lea weft with 22 ends per centimetre and 20 picks per centimetre. Operating parameters assume high-speed rapier looms running at 450 picks per minute with a fixed loom rate of $28.50 per machine hour, inclusive of capital depreciation, floor space, energy, and plant overhead. Operator labor costs $22.00 per hour per weaver.
Scenario A sets an allocation of 8 looms per weaver under a high-density warp break regime averaging 4.8 stops per loom-hour. Under this allocation, weaver interference drives loom shed efficiency down to 68 percent. Effective speed yields 306 picks per minute, producing 9.18 linear metres of grey cloth per loom hour.
Total combined cost per loom hour equals $28.50 base overhead plus $2.75 labor allocation ($22.00 divided by 8 looms), totaling $31.25 per loom hour. Dividing $31.25 by 9.18 metres yields a raw manufacturing cost of $3.40 per linear metre.
Scenario B adjusts operator allocation to 4 looms per weaver for the same high-density warp style. Reduced weaver interference elevates running efficiency to 86 percent. Effective machine speed rises to 387 picks per minute, generating 11.61 linear metres of fabric per loom hour.
Total combined cost per loom hour equals $28.50 base overhead plus $5.50 labor allocation ($22.00 divided by 4 looms), totaling $34.00 per hour. Dividing $34.00 by 11.61 metres yields a raw manufacturing cost of $2.93 per linear metre.
Allocating fewer looms per weaver reduces landed manufacturing cost by $0.47 per linear metre, a 13.8 percent saving. Higher labor costs are absorbed by substantial gains in machine productivity, while first-quality yield under ASTM D5430 inspection improves from 82 percent to 96 percent due to fewer dwell-induced starting marks. Optimized weaver loading protects both machine throughput and physical fabric quality.