Basic Methods for Measuring Flax Fiber Length Distribution
Accurate measurement of flax fiber length distribution requires converting between numerical count and mass-weighted metrics to control drafting waves.

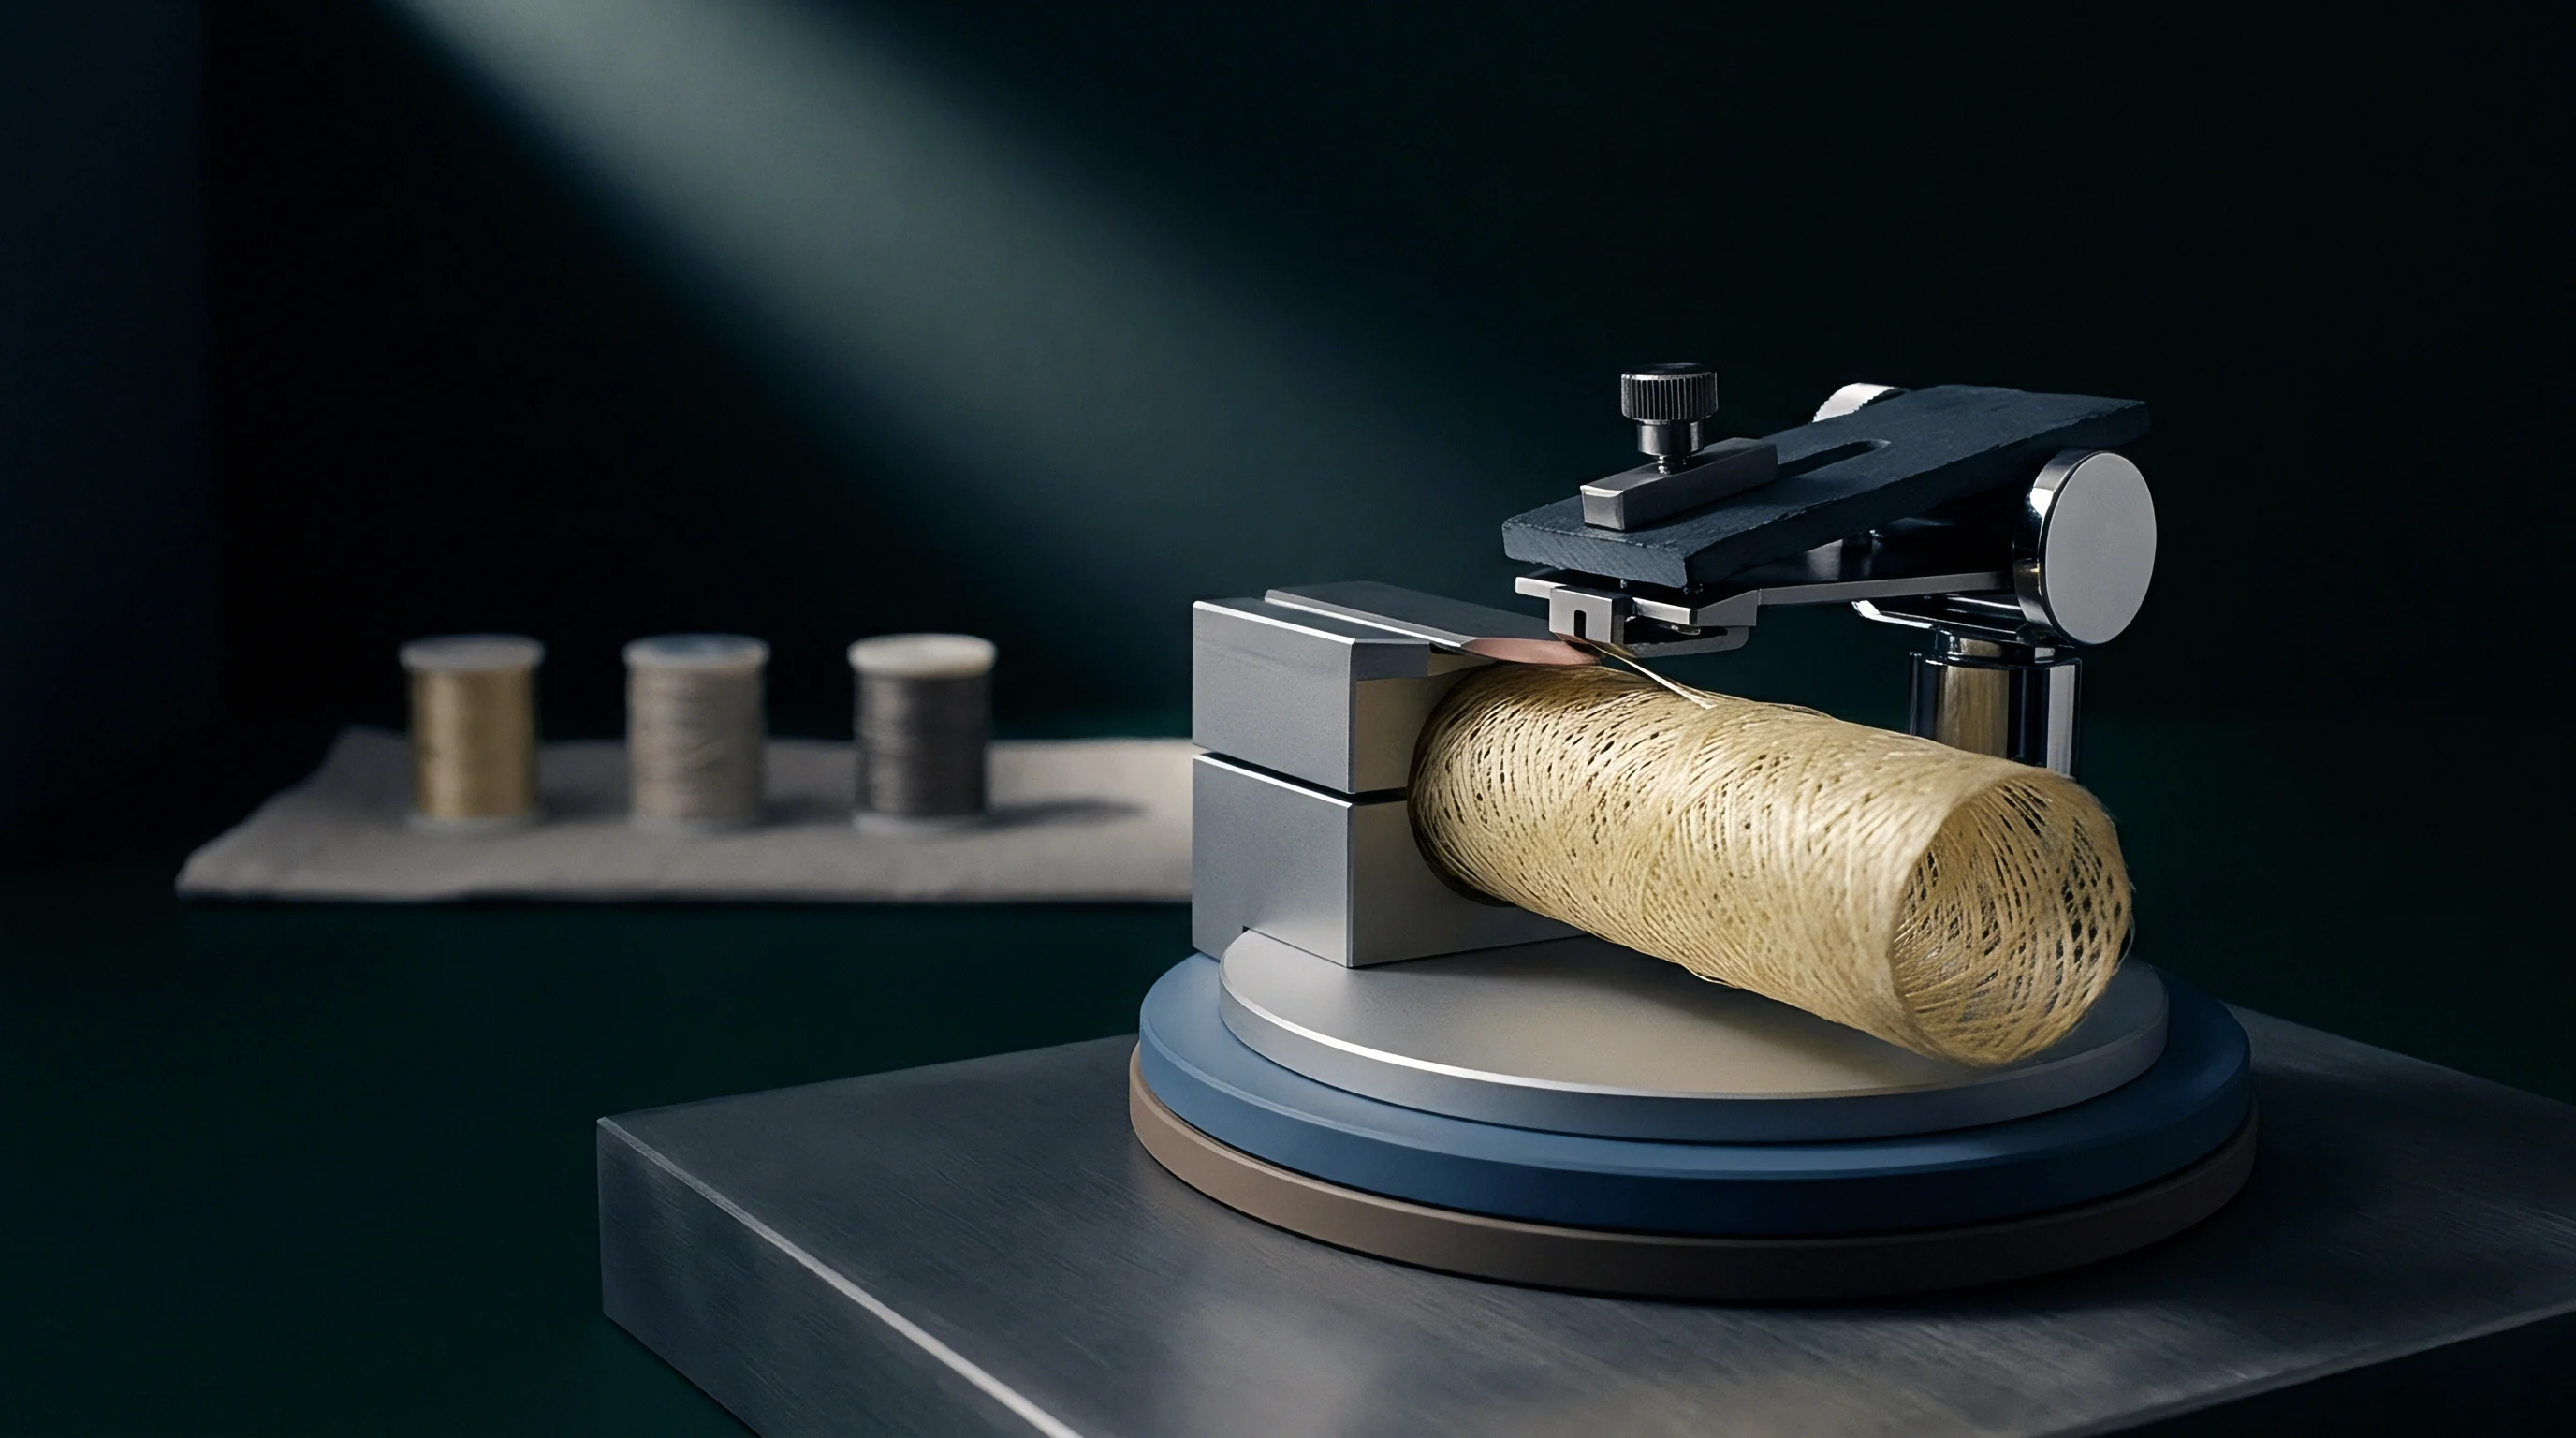
Sorter
Manual staple diagramming on velvet boards remains the reference baseline for assessing technical bast bundles before spinning. While high-volume cotton testing relies on automated instruments for fast throughput, the composite structure of long-staple bast fibers resists simple automated measurement. In the flax stem, individual ultimate fibers form complex bundle networks bound by a pectin matrix.
Processing steps like decortication, retting, and hackling break down these matrices only partially, leaving an irregular mixture of individual cells as short as fifteen millimeters alongside uncleaved bundles exceeding eight hundred millimeters. A manual comb sorter separates these bundles into physical length steps, producing a profile that reflects retting quality and mechanical damage from scutching.
The physical staple length directly governs the force required during roller drafting.
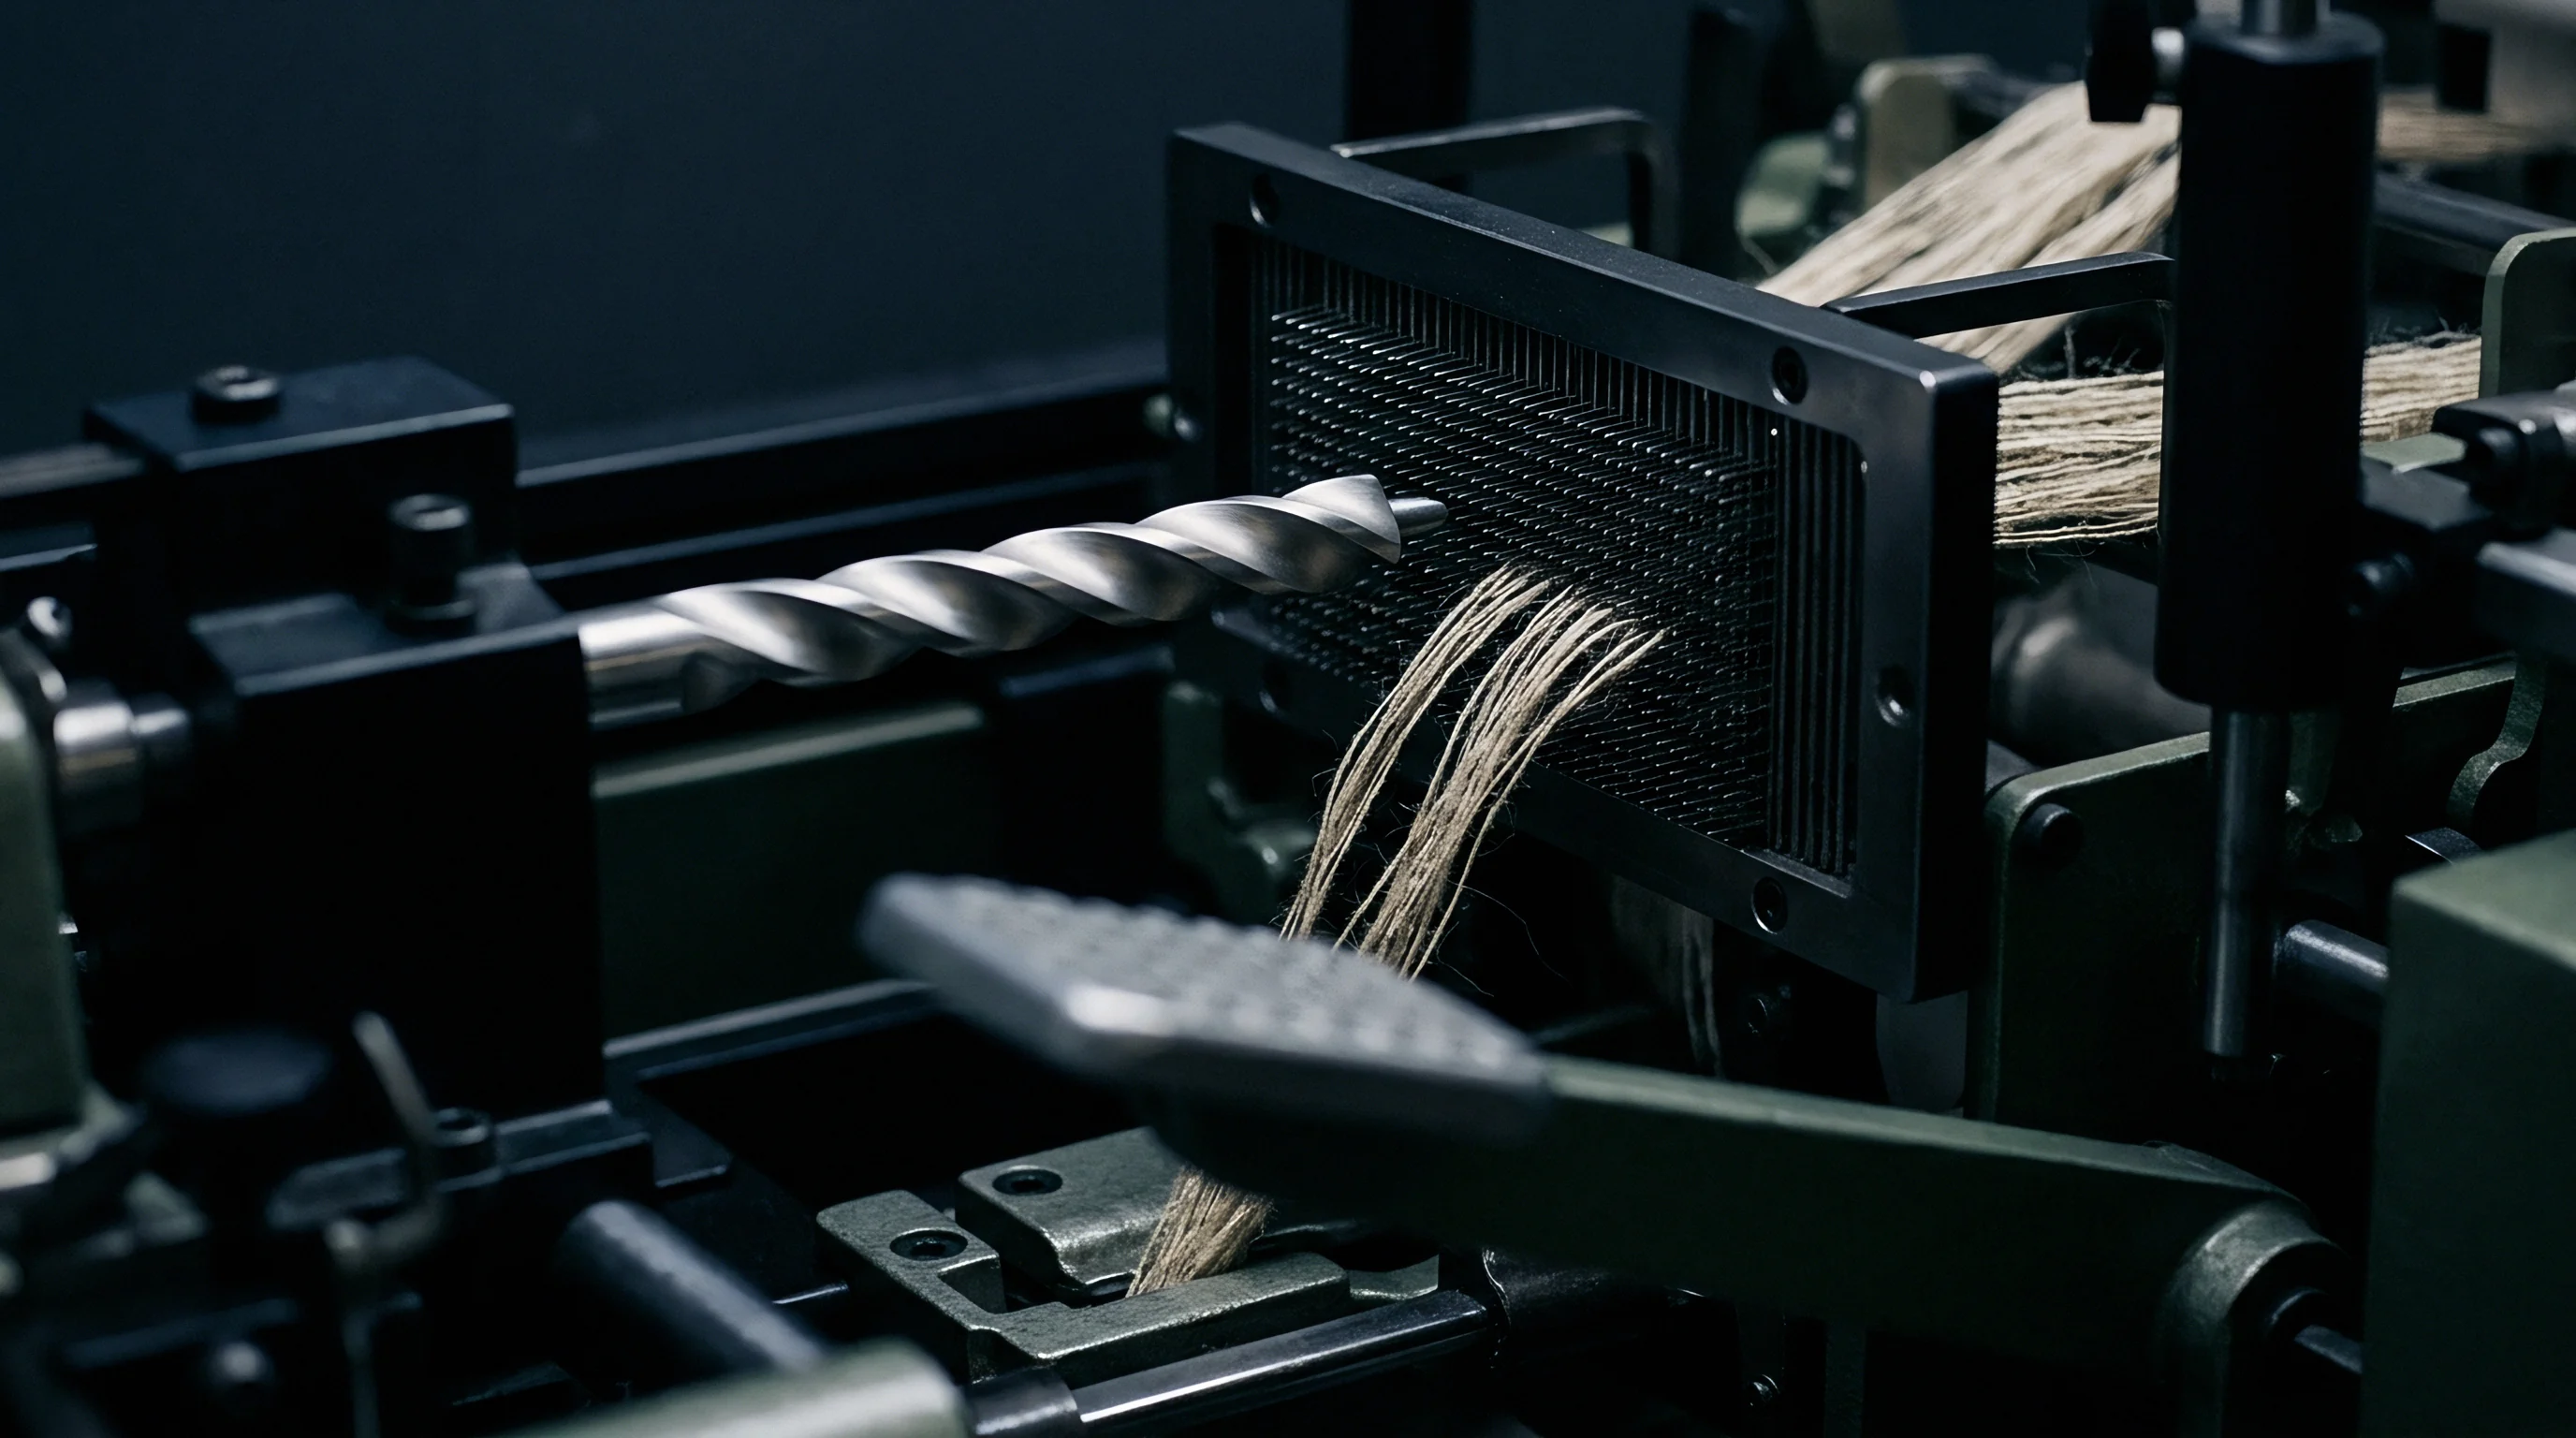
A comb sorter consists of two opposing banks of precision-spaced steel pins mounted on a heavy cast base. Double-banked arrays use pin spacings down to one-half millimeter to keep fibers from slipping during extraction. Analysts prepare a test specimen by drawing small tufts from at least twenty points across a conditioned five-kilogram bale sample.
Repeated hand-drawing and doubling blends these tufts to align technical bundles without snapping strands weakened by over-retting. The operator places this prepared mass into the lower comb bed and aligns the root ends at a zero baseline using fine grip pliers. As the longest protruding fibers are drawn out with tongs, successive combs drop away, and the extracted groups are laid onto a contrasting velvet board in descending order of length.
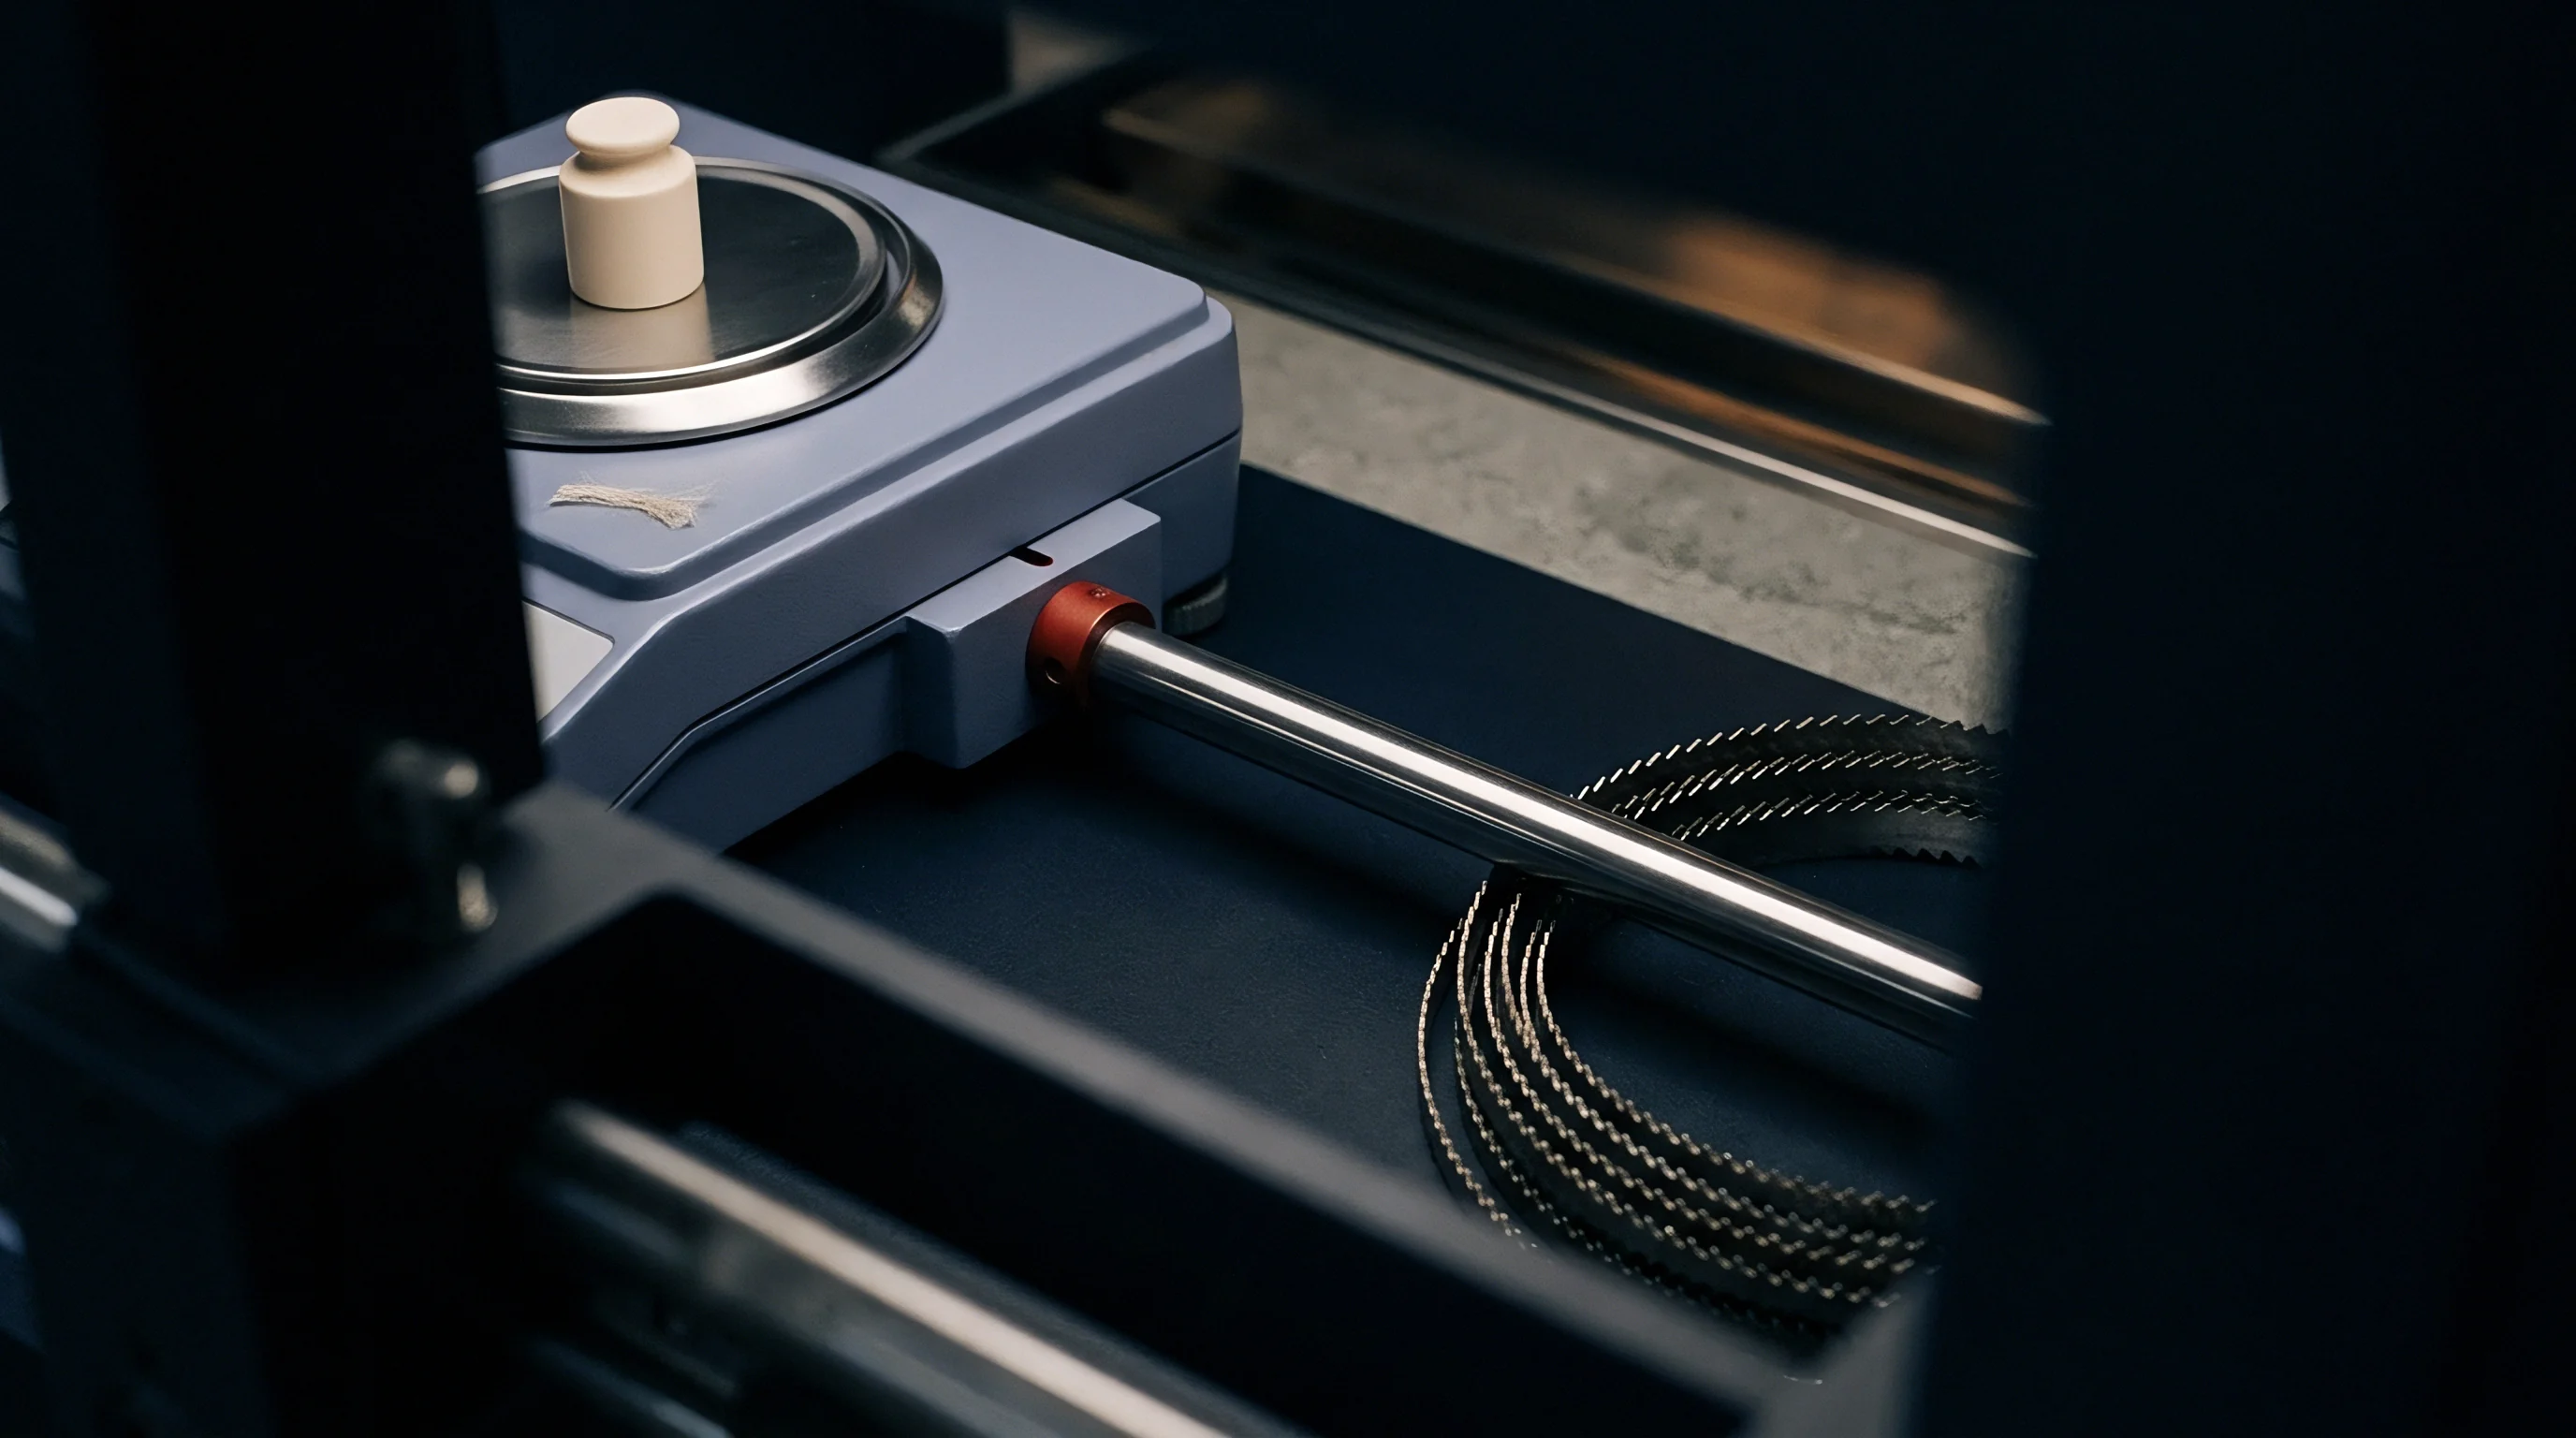
Manual Comb Diagramming Mechanics
Laying the drawn fiber groups in strict parallel order builds a visual staple diagram for direct measurement. The horizontal axis represents cumulative mass percentage, while the vertical axis records bundle length in millimeters. Tracing the tips of the aligned fibers produces a cumulative length distribution curve.
Three core parameters are derived from this curve: maximum length, mean length, and the percentage of fibers below a set threshold ~ typically thirty millimeters for long-line flax, where shorter strands contribute to nep formation.
| Parameter Type | Comb Spacing (mm) | Sample Mass (g) | Conditioning RH (%) | Tolerance Limit (mm) |
|---|---|---|---|---|
| Long Line Hackled Flax | 5.0 | 10.0 | 65 +/- 2 | +/- 2.5 |
| Scutched Tow Stock | 2.5 | 5.0 | 65 +/- 2 | +/- 1.5 |
| Refined Cottonized Flax | 1.0 | 1.5 | 65 +/- 2 | +/- 0.8 |
| Wet-Spun Roving Sliver | 2.0 | 2.5 | 65 +/- 2 | +/- 1.0 |
Manual diagramming requires skilled handling to keep fibers from pinching or snapping during extraction. Pulling strands too quickly through dense pin beds shears delicate bundles, artificially inflating the short-fiber fraction as the comb array isolates each length step.

Sample Preparation and Bundle Alignment
Thorough conditioning before sorting is essential because flax pectins are strongly hygroscopic. Standard protocols require at least twenty-four hours of exposure at sixty-five percent relative humidity and twenty degrees Celsius. Dry pectins become brittle, causing bundles to snap under the pull of sorter tongs, whereas overly damp bundles cling together through surface tension, dragging short adjacent fibers out of order and distorting the length profile.
Relative humidity fluctuations exceeding five percent during comb sorting alter the measured proportion of sub-thirty millimeter fibers by up to eight percent by mass.
Hand-squaring the specimen tuft prior to loading sets the baseline alignment. The operator draws small groups from the squared fringe, discarding the first two passes to remove loose, unaligned fibers before loading the remaining fringe into the sorter bed. Mass curves measured on comb sorters define baseline parameters for processing, providing the physical reference needed to calibrate rapid optical and capacitive instruments.

Johannsen Method Adaptation for Bast Fiber
Applying the classic Johannsen method to bast fibers requires modifying the group weighing process to account for broad variations in bundle mass. Each fiber fraction pulled from the comb bed is weighed on an analytical balance precise to one-tenth of a milligram. Because the branched structure of bast fibers makes direct counting impractical, the mass of each group is divided by its length interval to estimate relative numerical counts.
- Specimen Extraction ~ Draw a five-gram representative tuft from the conditioned bulk sample using cross-sectional sampling across the full length of the hackled strick.
- Primary Alignment ~ Mount the tuft in the rear comb bank, manually drawing and transferring fibers to the front bank four times to achieve parallelization.
- Comb Dropping ~ Lower individual comb bars systematically as the protruding fringe length drops below the top pin level.
- Fraction Grouping ~ Deposit extracted fiber groups onto the velvet array board in five-millimeter length increments from longest to shortest.
- Mass Determination ~ Weigh each length fraction immediately on a calibrated balance inside an environment-controlled chamber to prevent moisture loss.
Distribution parameters are calculated by plotting fractional masses against their mean interval lengths. The cumulative curve highlights the modal length ~ the dominant fraction that governs drafting stability during roving formation. A broad, flat curve points to uneven retting or heavy scutching damage, signaling poor yarn count uniformity and frequent end breaks in wet spinning.
Discrepancies between manual comb sorter diagrams and automated optical reports stem from hand extraction, which splits technical bundles along weak pectin nodes to yield an artificially fine, shortened length profile compared to undisturbed stock.


Image
High-resolution flatbed optoelectronic scanning captures thousands of fiber profiles on a glass plate within minutes. Automated optical systems bypass the operator variability of manual comb sorting and evaluate morphological traits that mechanical pin beds miss. Image analysis software processes high-bit-depth grayscale scans to delineate fibers, compute chord lengths, and track bundle diameter along the fiber axis.
For bast fibers, the primary computational challenge lies in distinguishing a single long, wavy technical fiber from two shorter, overlapping fibers positioned close together on the glass plate.
Spinning fine yarns requires tight control over fiber length uniformity.
Sample dispersion represents the primary bottleneck in optical image analysis. Laying raw bast fibers directly onto glass produces clumps and shadows that confuse edge-detection algorithms. Liquid dispersion resolves this issue by suspending trimmed fiber fragments in a viscous, non-swelling medium such as glycerol or silicone fluid.
The suspension is spread thin across a large glass slide, placed over an automated light table, and scanned at resolutions above two thousand four hundred dots per inch. Backlighting isolates fiber boundaries, providing sharp contrast along the longitudinal edges and internal nodes of flax bundles.

Automated Pixel Tracking Algorithms
Image processing software converts backlit scans into binary maps using adaptive local thresholding. Standard global thresholding proves inadequate because illumination varies slightly across wide scanner plates. Local adaptive thresholding calculates separate thresholds across small pixel windows, isolating fine ultimate fibers from dark technical bundles despite subtle shifts in background lighting.
Once the image is binarized, thinning algorithms reduce fiber geometry to single-pixel skeletons, measuring length along the central medial axis.
| Optical Instrument Type | Resolution (DPI / um) | Max Field Size (mm) | Particle Count / Run | Length Threshold (mm) |
|---|---|---|---|---|
| High-Resolution Flatbed | 4800 DPI / 5.3 um | 210 x 297 | 15,000 | 0.2 |
| Flow-Celled Optical Analyzer | 1200 DPI / 21.1 um | 50 x 50 (Flow) | 50,000 | 0.5 |
| Automated Microscope Stage | 9600 DPI / 2.6 um | 100 x 100 | 5,000 | 0.1 |
| High-Speed Conveyor Scanner | 2400 DPI / 10.6 um | 300 x 500 | 100,000 | 1.0 |
Skeletonization routines must handle the nodes and branching typical of partially retted flax. A branched bundle creates a skeleton with multiple endpoints, which basic path-length calculations misinterpret as oversized individual fibers or connected fragments. Specialized routines compute the curvature tensor along the thinned path, splitting the skeleton into distinct child fibers at sharp junctions or sudden step-changes in diameter.

Separating Overlapping Technical Fibers
Separating overlapping fibers relies on geometric continuity and crossing-point reconstruction. When two fiber skeletons intersect, the algorithm evaluates alignment vectors of approaching segments. Segments running nearly parallel through the intersection are reconnected as a single continuous strand, while those exhibiting sharp directional shifts are logged as crossing fibers.
This reconstruction prevents overlapping strands from registering as tangled networks, preserving numerical length distribution accuracy.
Direct optical analysis measures length and cross-sectional bundle diameter simultaneously. Because bundle diameter governs stiffness and drafting resistance, profiling both dimensions yields clearer operational insight than length measurements alone. Fine fibers flex easily around drafting rollers, whereas thick technical bundles resist bending and require higher roller nip pressure.
Combining optical length and width distributions generates a bivariate matrix that accurately predicts roving drafting force.
Standard ISO 137 testing routines for diameter measurement require explicit calibration against certified micro-glass rods when adapted for non-circular bast fiber cross-sections.
High-speed optical flow cells offer an alternative to static slide mounts. Chopped flax fibers suspended in liquid pass through a narrow quartz cell illuminated by a pulsed laser or high-power LED flash. High-speed digital cameras capture moving particles, evaluating thousands of fragments per second.
While flow cells process large sample volumes, hydrodynamic shear inside the channel tends to align long fibers parallel to the flow vector. This alignment occasionally sweeps long bundles out of the focal plane, undercounting the upper end of the length distribution.
Whether high-speed optical flow systems can reliably distinguish between a long bundle folded back on itself during liquid transport and a naturally branched technical fiber network without artificial post-processing is still debated among fiber metrologists.
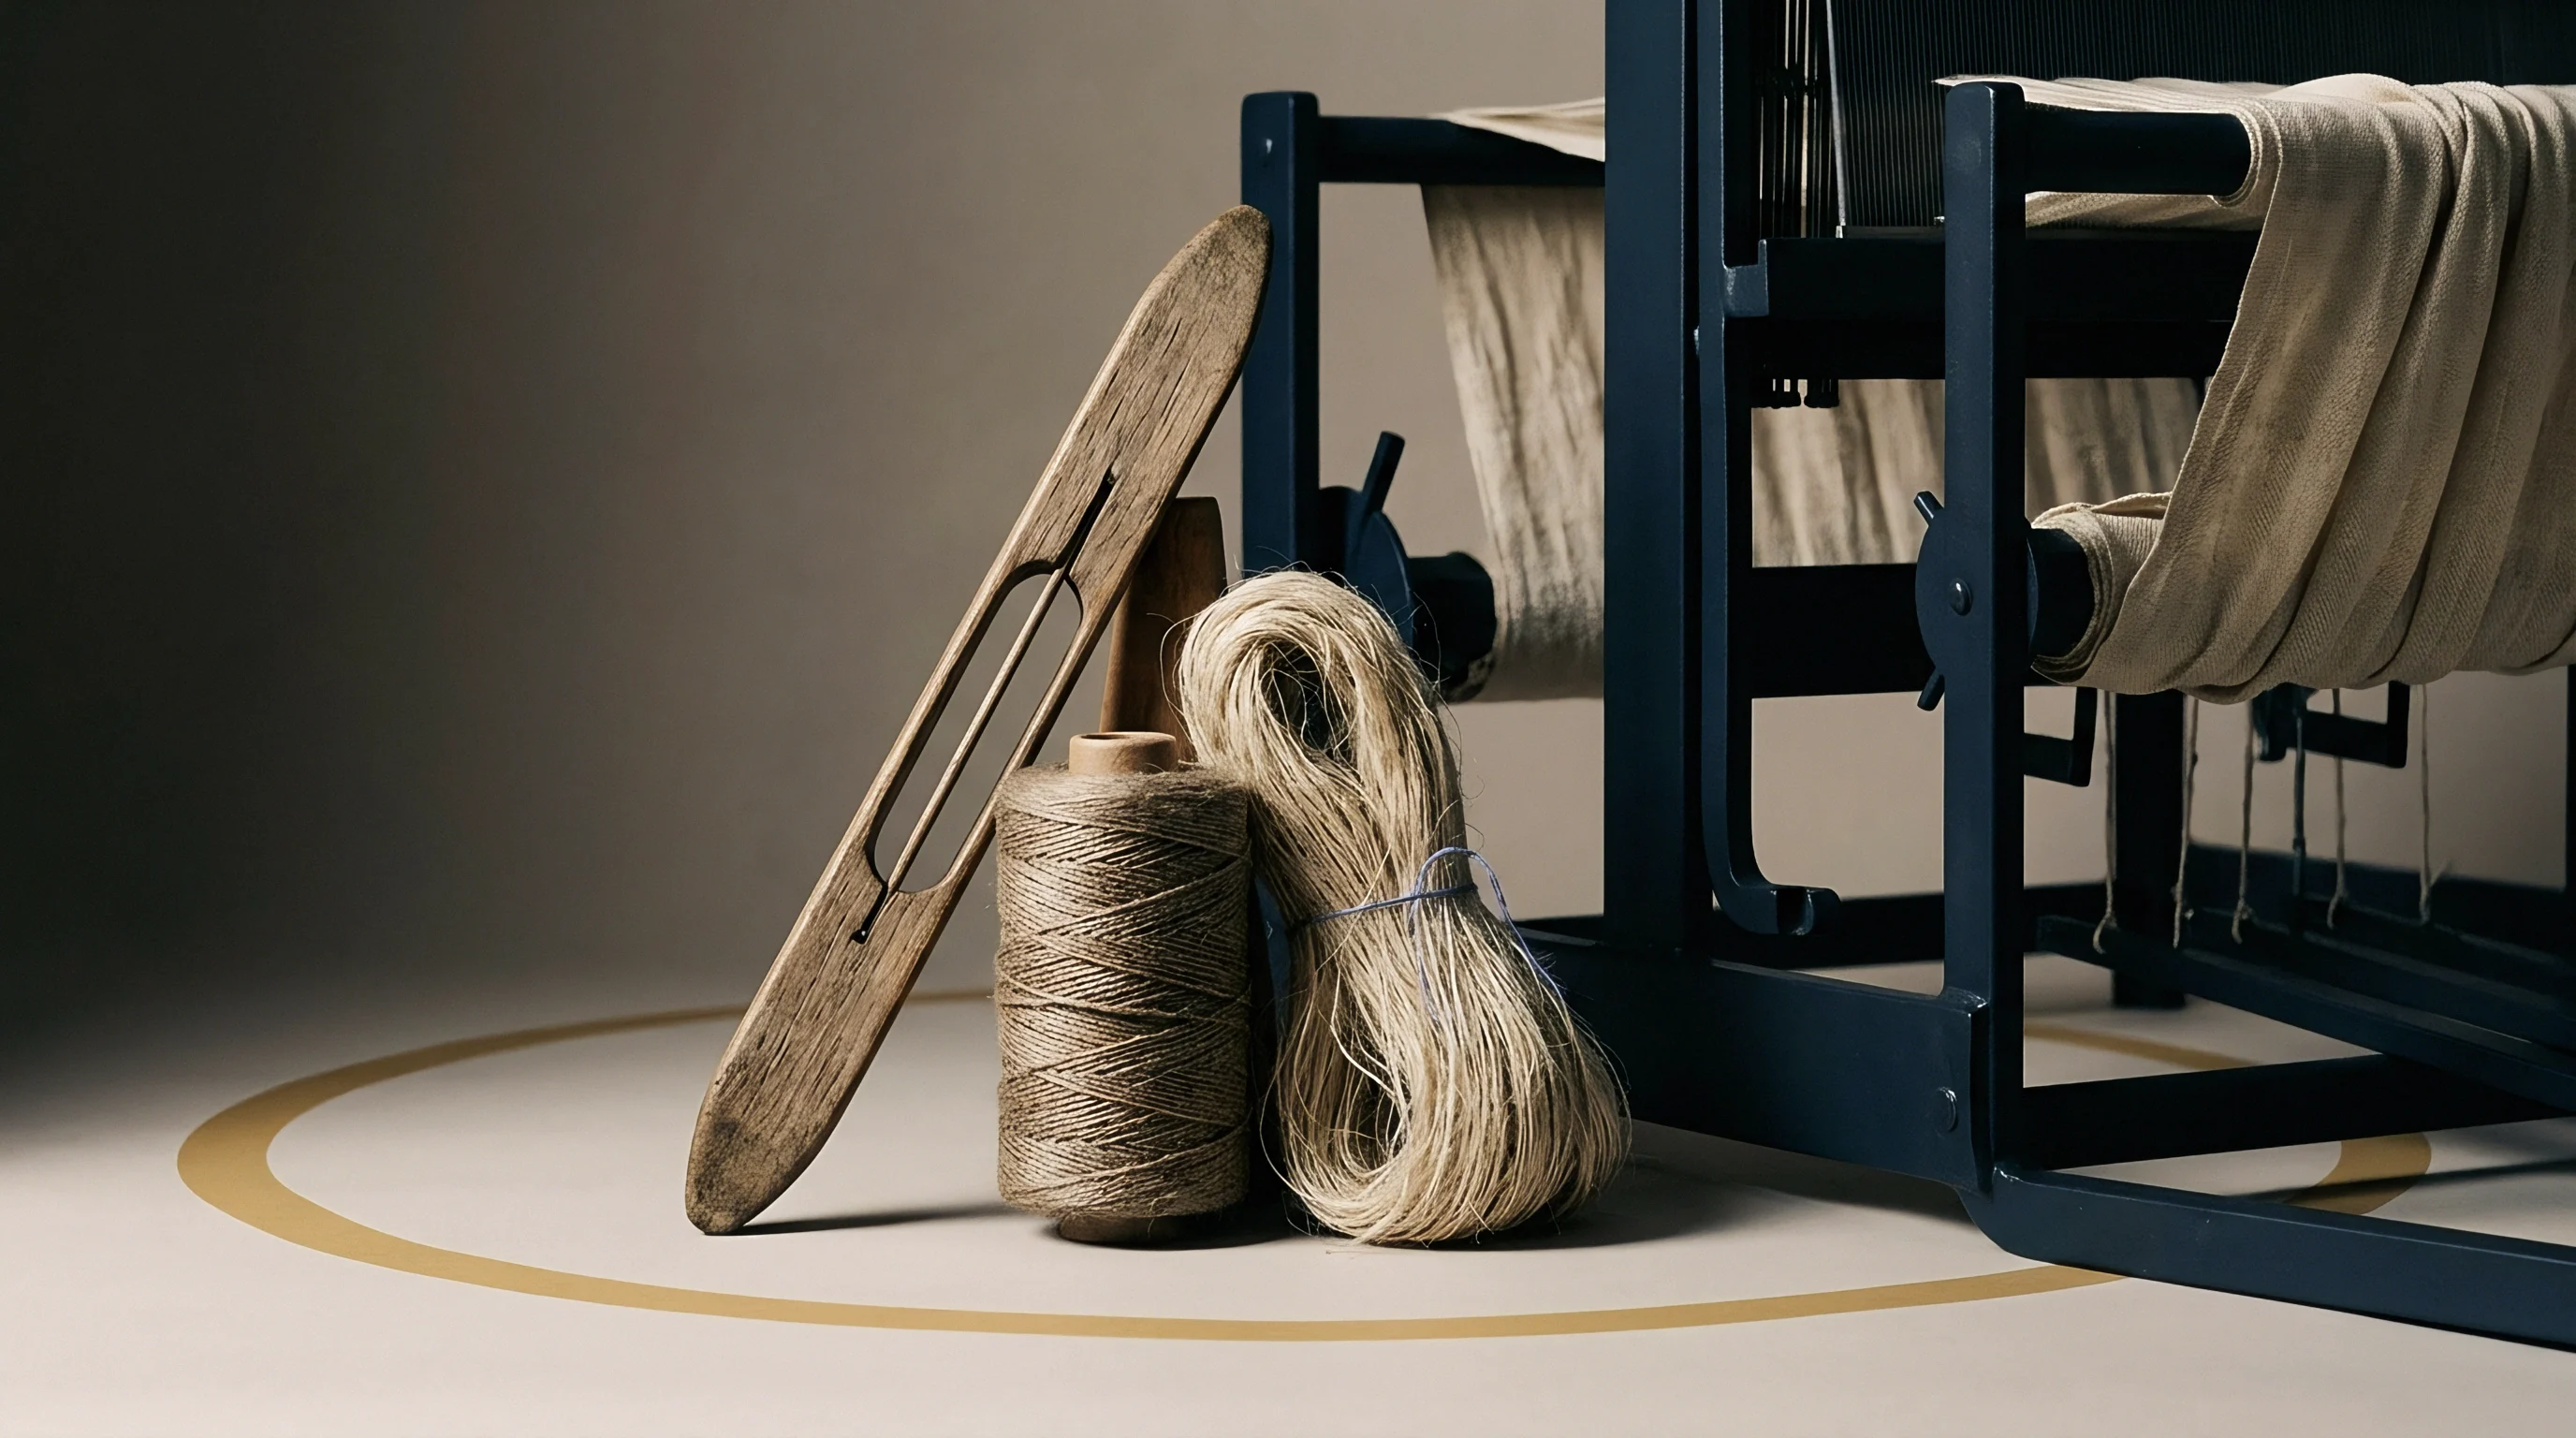

Pins
Mechanical drafting simulators use calibrated faller beds to evaluate pull-out force alongside staple length. Capacitive instruments like the Almeter pass a parallelized tuft through a sensor gap to map the cross-sectional mass profile along the bundle length. This converts direct visual length into mass-equivalent length, matching how spinning frames process fiber slivers.
Pin-based and capacitive systems process large samples rapidly, providing plant laboratories with a practical link between raw bale stock and sliver drafting performance.

Almeter Faller Bed Mechanics
Operating an Almeter requires rigorous sample preparation using a mechanical or pneumatic draw-box. The draw-box grips a combed tuft and draws it through fine pin beds to align the leading edge. This creates a tuft with root ends aligned at a uniform baseline, reproducing fringe geometry at the front roller of a draw frame.
The tuft is then mounted on a plastic carrier film and fed into the capacitive sensor gap at a constant speed.
Water retting preserves long technical bundles far better than mechanical or dry processing.
The sensor gap houses a high-frequency, high-voltage capacitive circuit. As the aligned tuft moves through, shifts in dielectric permittivity alter capacitance in proportion to the fiber mass positioned between the plates. The instrument tracks this mass signal against distance to generate a cumulative mass-length curve known as a draw diagram.
The system then differentiates this profile to derive both mass-weighted and numerical length distributions.
- Capacitive Sensor Drift ~ Uncalibrated humidity variations shift dielectric baseline values, causing systemic errors in total mass calculations across consecutive test runs.
- Pin Bed Damage ~ Bent or burred pins on the draw-box grip unit strip fine elementary fibers, skewing the length profile toward longer technical bundle counts.
- Pneumatic Pressure Drop ~ Insufficient clamping force during tuft transfer permits long fibers to slip, introducing artificial short-fiber tails into the draw diagram.
- Static Charge Accumulation ~ Low humidity testing generates electrostatic repulsion among dry flax fibers, causing tuft ballooning inside the capacitive measuring gap.
Calibrating capacitive instruments requires strict control over sample moisture. Water has a dielectric constant of roughly eighty, compared to approximately three for dry cellulose, so small fluctuations in moisture regain produce large jumps in signal amplitude. Samples must reach moisture equilibrium in a conditioned laboratory prior to testing.
Technicians calibrate the sensor gap daily using reference wool or synthetic tops with certified staple profiles.

Capacitance Sensor Calibration Protocols
Applying capacitive measurement to bast fibers introduces complexities absent in wool or synthetic processing. Flax fibers do not absorb moisture uniformly along their length because non-cellulosic impurities are distributed unevenly. Root sections retain more lignified tissue and residual pectin than mid-stem sections.
These chemical variations cause slight shifts in local dielectric constants, creating minor mass artifacts along the length of the tuft.
Drafting forces measured across faller beds reveal that a five percent increase in short-fiber content raises sliver mass variance by sixteen percent at the roving frame.
Despite dielectric nuances, combining pin sorting with capacitive scanning yields highly repeatable quality control data for wet-spinning operations. Mass-weighted results correlate directly with hackling yield, comb waste, and drafting force on production draw frames. Fast capacitive testing allows technicians to check incoming line flax lots before blending, keeping staple profiles consistent across multi-bale mixes.
Cohesion between technical fibers in a pinned bed depends on surface wax levels and the physical crimp index.


Statistics
Converting raw length data into practical spinning parameters requires accurate conversion between numerical count and mass distributions. A numerical distribution counts individual fibers within each length interval, treating a fine ultimate fiber and a heavy technical bundle as equal units. A mass-weighted distribution calculates the mass fraction contributed by each length group.
Because flax bundle cross-sections vary widely across length classes, converting between numerical counts and mass distributions requires precise mathematical adjustment.
Faller beds maintain controlled sliver density during mechanical drafting.
Mathematical conversion from numerical length distribution N(l) to mass-weighted distribution M(l) requires accounting for variable linear density across length steps. Assuming a constant average linear density t, the mass fraction mi for a given length step li with numerical count ni is calculated using the following fundamental relationship:
mi = fracni · li · tisumj=1k (nj · lj · tj)
If linear density increases with length ~ which occurs when long flax bundles contain thicker technical strands ~ failing to adjust linear density ti across length steps distorts the calculation, understating the mass contribution of the longest fibers.
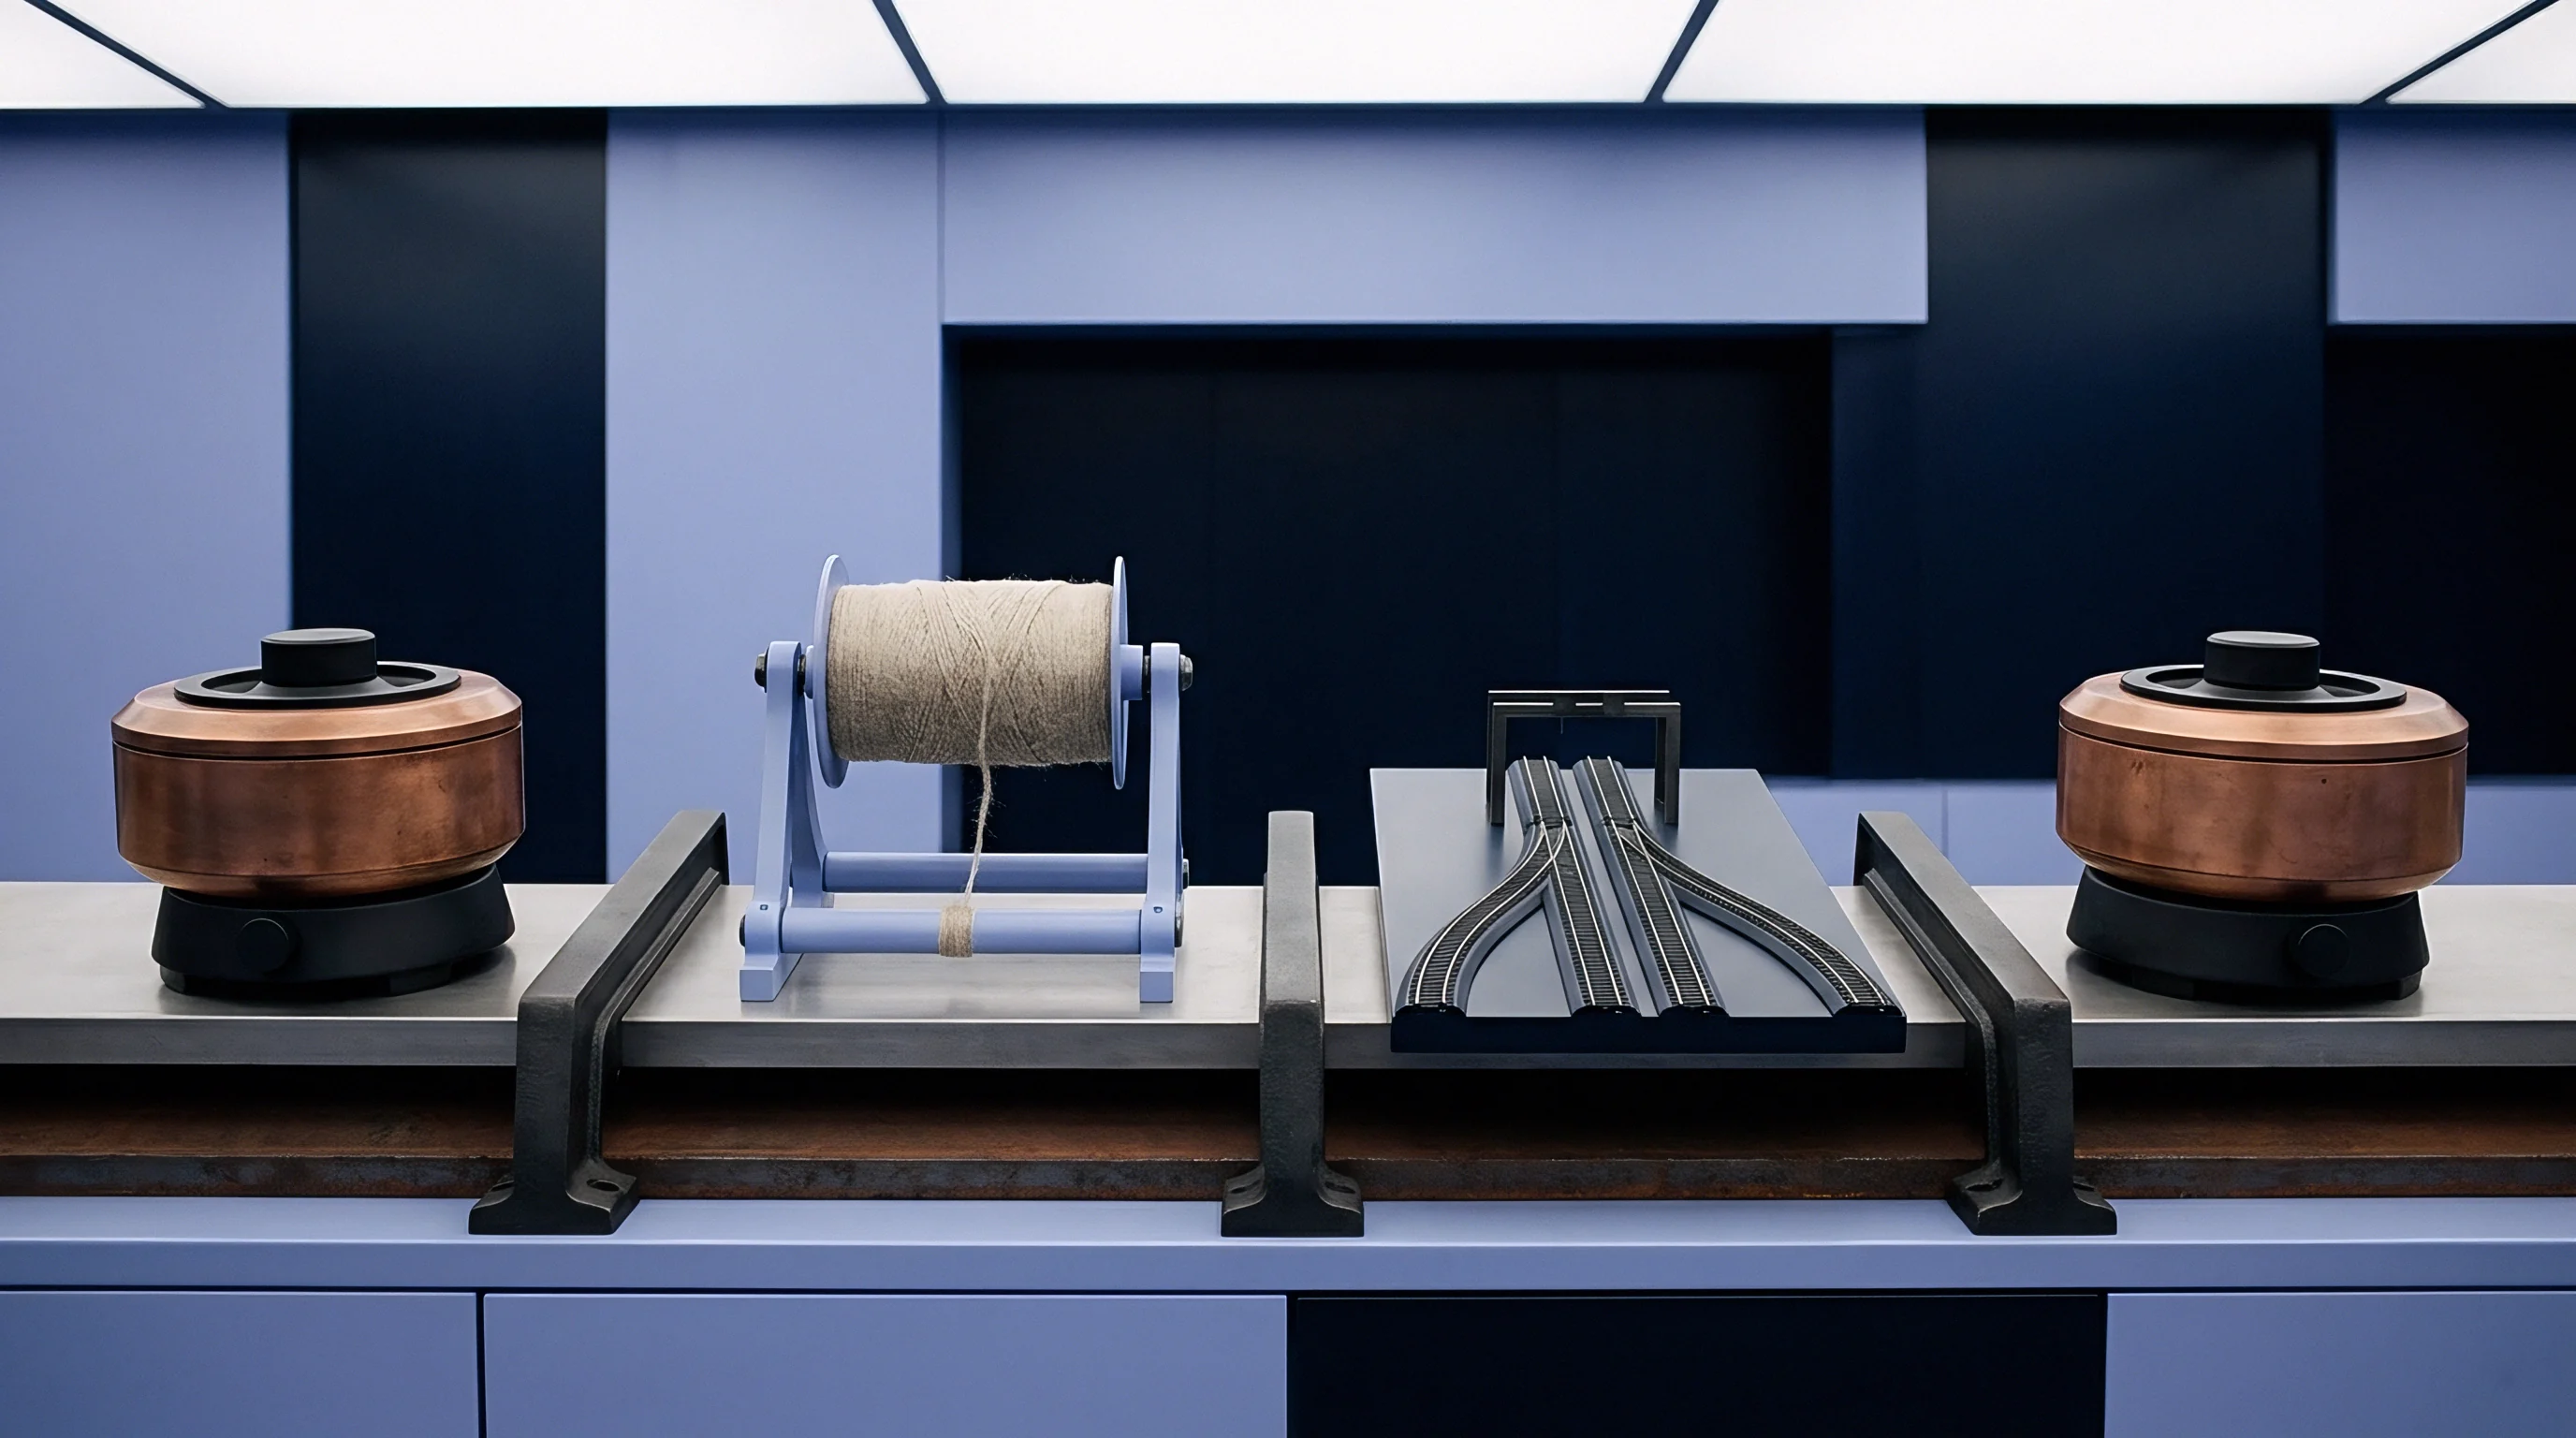
Numerical Count versus Mass Distribution
The gap between numerical and mass distributions directly influences machinery settings. Numerical distributions highlight high counts of short fibers that trigger end breaks and fly waste in spinning. Mass distributions govern drafting roller settings, gauge distances, and sliver attenuation.
Relying solely on mass-weighted average length masks short-fiber contamination, leading to drafting waves and irregular yarn counts.
| Flax Fiber Commercial Grade | Mean Length Num. (mm) | Mean Length Mass (mm) | Short Fiber Content (<30mm %) | Weibull Shape Factor (beta) |
|---|---|---|---|---|
| Water-Retted Long Line (Grade A) | 210.5 | 480.2 | 3.2 | 2.85 |
| Dew-Retted Long Line (Grade B) | 175.0 | 410.8 | 6.8 | 2.10 |
| Green Scutched Line (Unretted) | 140.2 | 365.4 | 12.4 | 1.65 |
| Combed Hackled Tow (Grade C) | 42.5 | 88.6 | 22.5 | 1.42 |
| Cottonized Enz-Treated Flax | 18.2 | 26.4 | 78.5 | 3.15 |
Flax length distributions are frequently fitted to a two-parameter Weibull probability density function. The Weibull model accommodates the right-skewed distributions characteristic of natural bast fibers damaged during mechanical processing.

Why Do Mass Weighted Distributions Bias Bast Grading?
Mass weighting emphasizes heavy technical bundles while undercounting fine, lightweight ultimate fibers that dictate yarn hairiness and handle. In a dew-retted flax lot, a single eight-hundred-millimeter bundle containing dozens of uncleaved fibers can weigh as much as thousands of short ultimate cells. If quality checks rely exclusively on capacitive mass metrics, stock with severe short-fiber contamination can pass inspection because large bundles dominate the mass curve.
Comparing optical numerical counts against capacitive mass profiling across hackled line bales isolates this precise distortion.
The mathematical formulation for the cumulative Weibull length distribution function F(l) takes the explicit form:
F(l) = 1 – expleft( -left( fraclη right)β right)
The scale parameter η represents the characteristic length in millimeters, below which sixty-three point two percent of the fibers fall. The shape parameter β indicates distribution uniformity. Higher shape parameters mark narrow, uniform distributions, while lower values point to broad, varied lengths prone to drafting instability.
Weibull and Log Normal Fit Calculations
Fitting comb sorter or optical data to a Weibull distribution allows analysts to calculate key trade percentiles like upper half mean length and span length parameters. The span length L2.5% marks the length exceeded by only two point five percent of fibers in the sample, setting the maximum roller gauge distance needed to avoid floating fibers and sliver breakage.
- Data Array Sorting ~ Arrange raw length measurements or fraction midpoints in ascending order alongside their corresponding cumulative mass or count frequencies.
- Logarithmic Transformation ~ Calculate the double-logarithmic transformation ln(-ln(1 – F(l))) for each cumulative frequency value.
- Linear Regression Analysis ~ Plot the transformed values against the natural logarithm of length ln(l) to execute a linear least-squares regression fit.
- Parameter Extraction ~ Derive the shape parameter β directly from the regression slope and compute the scale parameter η from the y-intercept value.
- Goodness of Fit Check ~ Evaluate the coefficient of determination R2 to ensure the Weibull model accurately reflects the empirical tail distributions.
Log-normal distributions offer an alternative fit for heavily processed or cottonized flax, where carding and degumming reduce fibers toward ultimate dimensions. For raw and long-line hackled flax, however, log-normal models understate the upper tail, making Weibull the preferred model for bast fiber metrology.
Under standard international contract guidelines, if mass-weighted span lengths deviate by more than four percent from baseline lab curves, the lot must be re-tested by a neutral third party.

Spinning
Drafting stability during yarn attenuation depends heavily on the fraction of short fibers under thirty millimeters. When flax sliver enters the drafting field of a roving or spinning frame, back rollers feed the strand while faster front rollers draw it down. Long technical fibers are controlled by both roller sets or guided by faller pins, accelerating smoothly.
Unclamped short fibers in the drafting zone move unpredictably, pulled forward early by friction from adjacent strands. This creates periodic mass variations ~ drafting waves ~ that appear as thick and thin places in finished yarn.
Excessive retting degrades the pectin binder, weakening technical fibers before drafting.
Hackling represents the primary mechanical step used to refine flax length distributions for spinning. Raw scutched flax stricks pass through sets of increasingly fine steel pins mounted on moving aprons. The pins comb out tangles, break weak pectin links, align long fibers, and discard short fragments as tow.
Adjusting pin density, speed ratios, and penetration depth enables operators to tailor line flax length profiles for target yarn counts.

Hackling Yield and Tow Generation Rates
Balancing hackling yield against fiber alignment requires adjusting pin beds to match how effectively incoming fiber was retted. Under-retted flax contains tough pectin bonds that resist combing, snapping fibers and generating excess tow. Over-retted flax features weakened cell walls that fracture under light pin impacts, converting valuable long fiber into tow.
When incoming stock length variations force aggressive re-hackling settings, yield drops by roughly 4 percent across wet-spun lots.
| Process Stage | Mean Length Mass (mm) | CV of Length (%) | Short Fiber Ratio (<30mm %) | Drafting Force (N) |
|---|---|---|---|---|
| Raw Scutched Line Flax | 380.0 | 45.2 | 14.8 | 18.5 |
| First Passage Hackled Line | 450.2 | 32.1 | 5.2 | 24.2 |
| Combed Hackled Tow Sliver | 110.5 | 38.5 | 18.2 | 8.4 |
| Third Passage Draw Sliver | 420.0 | 28.4 | 3.8 | 21.0 |
| Boiled Wet-Spinning Roving | 395.0 | 24.2 | 2.1 | 15.2 |
Length distribution directly affects yarn tensile strength. Longer technical fibers provide greater contact area within the twisted yarn, increasing internal friction and preventing slippage under tension. Fine wet-spun yarns demand strict length uniformity to eliminate thin spots where excess twist concentrates, creating weak points prone to breaking during weaving or knitting.

Roving Attenuation and End Breakage Frequency
In wet spinning, roving passes through a hot water bath before entering the drafting zone. Water heated to sixty through eighty degrees Celsius softens residual pectins, allowing ultimate fibers to slide past one another during attenuation. This thermal softening alters the effective length distribution during drafting itself, thinning bundles without destroying ultimate fiber length.
If the raw material exhibits too broad a length range, softening causes irregular draft slip, driving up yarn count variation and end breaks at the spindle.
Wet spinning bath temperatures below sixty degrees Celsius fail to soften bundle pectins sufficiently, increasing drafting force variations by thirty percent and triggering frequent roving breakage.
Dry spinning, used for coarser yarns and technical textiles, omits the hot water bath. It relies entirely on the initial mechanical length distribution of the dry sliver to maintain cohesion. As a result, dry-spun flax requires longer starting staple and higher twist to achieve adequate strength, raising raw material cost per kilogram.
Commercial trials showed that a two percent increase in short-fiber content raised spindle end breaks from twenty-two to sixty-seven interruptions per one thousand spindle hours, severely cutting frame efficiency.


Invoice
Commercial settlement for long-line flax relies on standardized moisture levels and specified staple tolerances. Because raw fiber is purchased by weight, length parameters are incorporated into purchase contracts to protect buyers from yield losses caused by excess tow. A standard invoice details net delivered weight, moisture regain, commercial weight adjustments, and certified staple metrics derived from agreed test standards.
Deviations from contract length specs trigger price adjustments or lot rejection.
Dry-spun processing relies on longer starting staple lengths to achieve acceptable yarn strength.
Binding contract terms require explicit test standards, sampling frequencies, and statistical limits. Contracts citing ISO standards spell out procedures for sampling, atmospheric conditioning, and measurement. Clear clauses on span length, short-fiber limits, and maximum length variation protect both spinner and merchant from post-delivery disputes.
Standard Sampling Procedures for Arbitration
Arbitration sampling rules require taking samples from at least ten percent of the bales in a shipment lot. Samples must be pulled from different depths within each bale using core samplers or by hand along clean fracture lines. Combining and conditioning these samples produces a composite gross sample for lab testing.
Excessive short fractions exceeding contract limits by six percent frequently result in the rejection of dew-retted stock.
- Sampling Method Standard ~ Specify ISO 2370 for fiber fineness and ISO 6741 for commercial mass and moisture calculations in all purchase orders.
- Length Distribution Limits ~ Mandate a maximum allowable short-fiber fraction below thirty millimeters of no more than five percent by mass for Grade A line flax.
- Span Length Thresholds ~ Enforce a minimum fifty percent span length parameter to guarantee drafting performance on high-speed draw frames.
- Arbitration Protocol ~ Require neutral re-testing at a certified independent textile laboratory if buyer and seller test results differ by more than three percent.
Lot purity affects both landed cost and processing economics. Unretted shive, weeds, and short tow represent waste mass removed during hackling. Standard invoice calculations adjust billing weight for clean fiber yield, deducting the percentage of non-spinnable short fibers and trash from gross delivered weight.

Contractual Penalty Clauses and Moisture Adjustments
Price adjustment formulas build linear or stepped penalties directly into the contract. A standard clause deducts one point five percent from the price per kilogram for each one percent increase in short fibers above the agreed baseline. If short-fiber content exceeds the baseline by more than five percent, the buyer has the right to reject the shipment at seller expense or negotiate a steep discount.
Contractual penalty clauses based on certified mass-weighted length distributions reduce raw material quality claims by over seventy percent across multi-national sourcing agreements.
Moisture regain calculations run alongside length checks during commercial settlement. Standard regain for flax is twelve percent under standard atmospheric conditions. Shipments delivered at higher moisture levels incur immediate weight deductions so spinners do not pay line fiber prices for absorbed water.
Flax purchase agreements specify that when automated optical testing and comb sorter mass profiles disagree beyond agreed tolerances, official settlement defaults strictly to the physical comb diagram mass distribution executed under established European flax trade association protocols.