Optical Fibre Length Profiling in Hackled Line Slivers and Tows
Optical length profiling converts light obscuration along clamped flax beards into precise span length metrics that dictate drawing roller settings and spinnable Nm.
Optics
Light attenuation through bast fibre assemblies obeys modified Lambert-Beer transmission laws governed by local bundle mass density. When scanning long-staple flax strands, photo-detector arrays register shadows cast by aggregated technical fibres rather than individual plant cells. Single elementary flax cells measure between fifteen and forty millimetres in length, but retting and scutching leave these ultimates glued together by pectin networks.
The resulting technical bundles span length ranges from fifty millimetres in coarse tow up to nine hundred millimetres in fully hackled line stock.

Transmission Dynamics in Unmilled Bast Assemblies
Photometric sensors detect physical cross-sectional area variations as a clamped specimen passes through a focused light beam. Flax fibres exist as bundles. Pectins hold these bundle structures.
Optical sensors measure light loss. Solid-state line-scan sensors operating at near-infrared wavelengths between eight hundred fifty and nine hundred forty nanometers eliminate colour variations caused by retting degree differences. Dew-retted flax with dark grey surface pigmentation absorbs light identically to pale gold water-retted stock when measured in this waveband.
Calibration protocols rely on relative obscuration values calibrated against volumetric mass across the sensor aperture.
Light transmission through a hackled flax beard correlates with total bundle cross-section rather than individual ultimate fibre boundaries.
Thick technical bundles create localized opacity spikes that mimic clusters of shorter strands if cross-sectional fineness varies across the strand length. Modern optical length profilers compensate for variable fineness by integrating total integrated light blockage along the extended beard length. The instrument calculates a continuous profile of relative fibre mass from the clamping line to the tip of the longest extended strand.
This profile generates a cumulative length distribution curve representing the true spinnable length of the delivery head.

Technical Bundle Splitting and Obscuration Signals
Mechanical stress during drawing causes continuous longitudinal cleavage of bast bundle connections. As hackled line slivers move through drawing frames, high-density pin fields split wide bundles into finer technical strands. Optical profiling instruments must evaluate whether a length distribution measurement reflects unhackled raw stock or split sliver ready for roving.
Tow contains higher short content. Fine strands absorb light differently than coarse aggregates. When analyzing tow sliver, lower mass density requires adjusted gain settings on the receiver array to prevent background noise from registering as short fibre fragments.
Instrument manufacturers frequently attribute line-scan calibration drift in tow profiling to variable residual shive content rather than sensor non-linearity.


Comb
Accurate length profiling depends upon rigid specimen alignment prior to optical scan execution. Preparing a sample from a hackled line sliver requires manual or automated comb sorting techniques to establish a straight, zero-reference clamping line. Without uniform initial gripping, loose fibre ends shift during movement past the photodiode sensor array, corrupting the length axis calculation.

Beard Preparation and Comb Alignment Mechanics
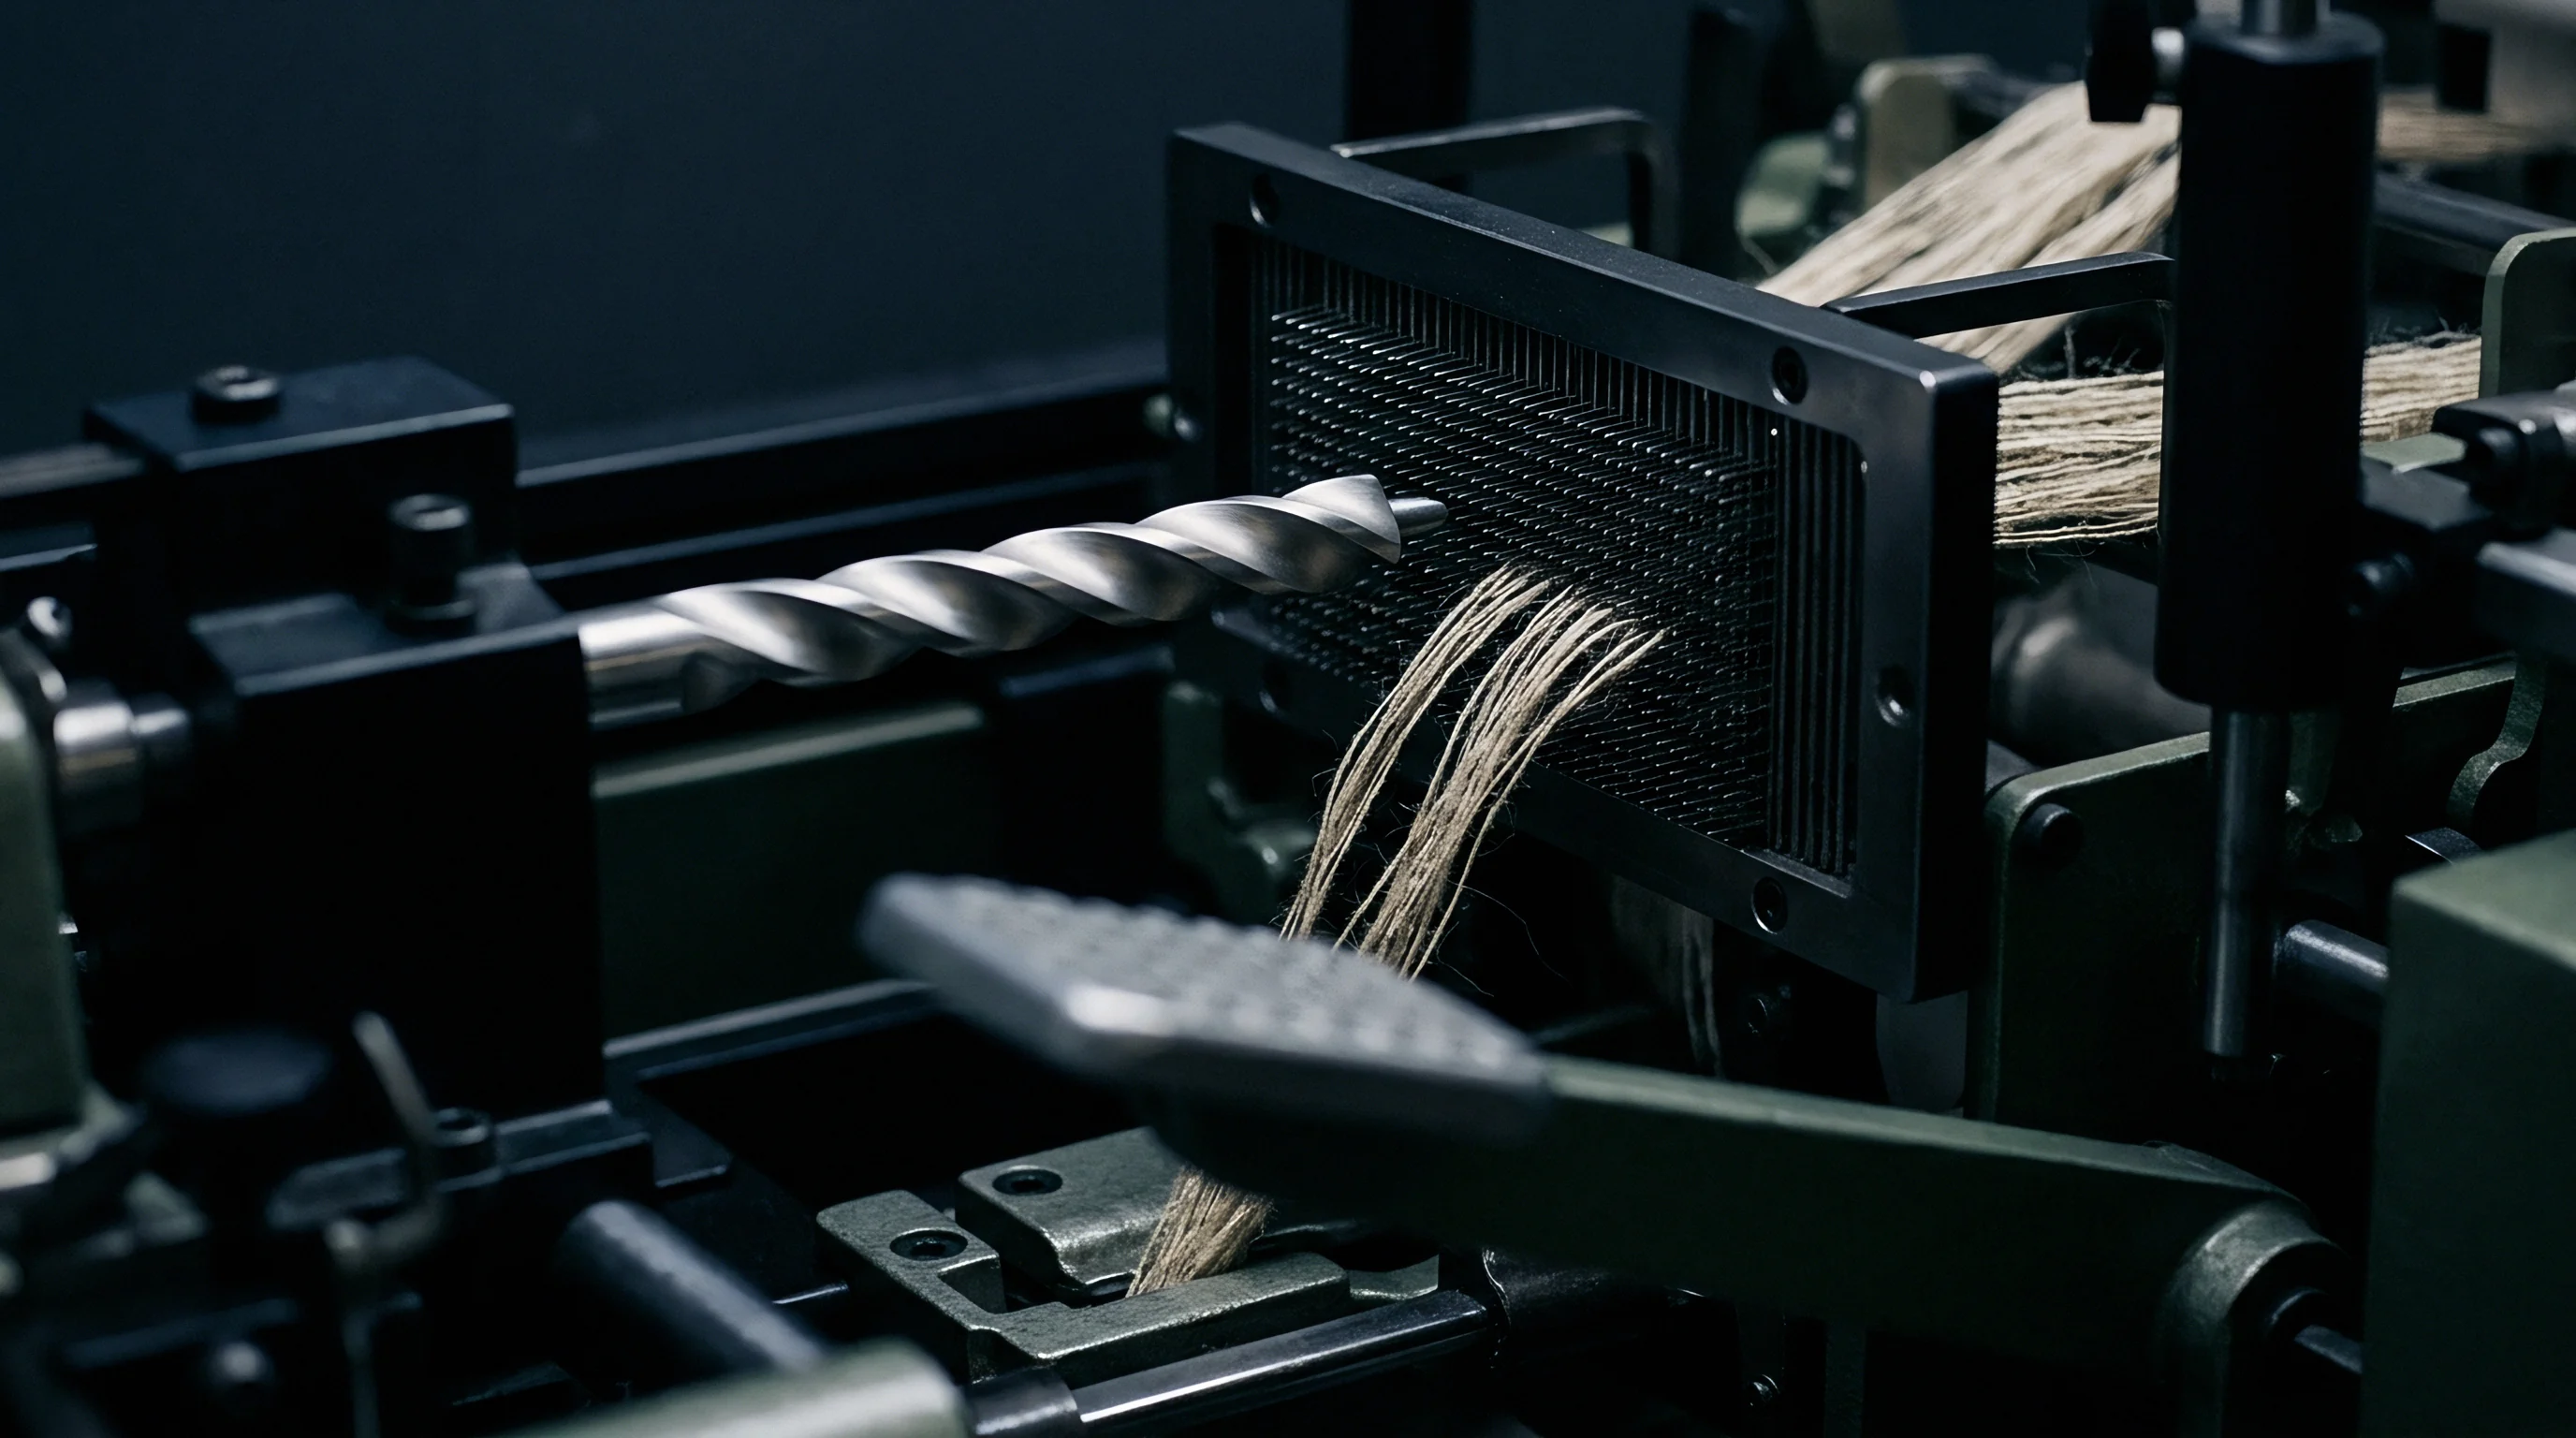
Precision sample preparation converts a loose, chaotic bundle into a planar beard suitable for light attenuation profiling. Combing removes unaligned fibres. Operators transfer small tufts from delivery slivers across a series of fine steel pin beds to remove crisscrossed fragments and residual shive particles.
Clamping jaws grab the aligned bundle exactly five millimetres from the combed margin, ensuring that every strand shares a unified start coordinate.
Moisture changes optical thickness measurements. Test specimens require conditioning under ISO 139 standard atmospheric conditions at twenty degrees Celsius and sixty-five percent relative humidity for twenty-four hours before testing. Deviations in moisture regain alter fibre opacity and flexural rigidity, altering how strands settle across the scanning window.
Standard conditioning at twenty degrees Celsius and sixty-five percent relative humidity prevents electrostatic clinging during optical beard transit.
Standardized Optical Bench Workflow for Flax Slivers
Execution of length profiling on bast stock follows a rigorous physical sequence to yield reproducible fibrograms.
- Extract a twenty-gram sliver segment across the full cross-section of the draw-frame delivery head.
- Align technical bundles using a double-row hand comb set to remove loose unaligned tow.
- Mount the prepared bundle into the pneumatic clamp with five bar holding pressure.
- Pass the exposed beard through the light-emitting diode scanning zone at twenty millimetres per second.
- Record the relative light intensity profile across the full length of the extended beard.
| Test Parameter | Manual Comb Sorter | Optical Line-Scan Profiler | High-Speed Image Analysis |
|---|---|---|---|
| Sample Preparation Time | 45 to 60 minutes | 8 to 12 minutes | 15 to 20 minutes |
| Operator Bias Vulnerability | High | Low | Medium |
| Maximum Measured Length | 1000 mm | 900 mm | 500 mm |
| Short Fibre Resolution (< 20 mm) | Poor | High | High |
| Data Repeatability (CV %) | 8.5 % | 1.8 % | 3.2 % |
A comb set adjusted too loosely allows short technical fibres to slip unmeasured, while excessive pin density snaps sound line bundles during beard preparation.


Distribution
Raw obscuration data captured along the scanned beard length converts mathematically into a cumulative fibrogram. This curve plots the percentage of total bundle mass extending beyond any given distance from the clamping line. Derived span lengths provide spinning technicians with direct physical parameters for machine setting rather than abstract statistical averages.
Does Fibrogram Analysis Accurately Isolate Flax Technical Fibres?
Converting optical obscuration into true length parameters requires clear definition of span length thresholds. The two point five percent span length represents the distance from the gripping edge reached by the longest two point five percent of total fibre mass. In hackled line flax slivers, this figure reflects the maximum length of sound technical bundles, dictating the minimum distance required between drafting rollers.
The fifty percent span length indicates average bundle extension, providing an index of length uniformity.
Uniform slivers draft without breaking. Short fibres slip during drawing. Computing the ratio between fifty percent span length and two point five percent span length yields the uniformity ratio.
High uniformity ratios above forty-five percent indicate premium hackled line stock, whereas tow slivers routinely exhibit uniformity ratios below twenty-eight percent due to high short fibre content.
Contractual specification of two point five percent span length prevents draft waves during subsequent wet drawing operations.

Calculated Span Metrics and Short Fibre Content Ratios
Interpreting length profiles requires identifying structural defects within the distribution curve that cause spinning failures.
- Pectin agglomeration tails distort the upper span length by recording two overlapping technical bundles as a single continuous strand.
- Shive shadow interference reduces transmitted optical density, causing the sensor software to report artificially inflated cross-sectional mass.
- Fibre crimp deflection bends shortened tow strands away from the optical plane, undercounting fibres below fifteen millimetres.
- Transverse bundle splitting during beard combing generates fine fibrillar debris that elevates the reported short fibre percentage.
Consider a comparative analytical profile between a premium hackled line sliver and an engine-carded flax tow sliver. The hackled line sliver exhibits a two point five percent span length of seven hundred forty millimetres, a fifty percent span length of three hundred sixty millimetres, and a short fibre content below fifty millimetres of two point eight percent. The tow sliver records a two point five percent span length of two hundred ten millimetres, a fifty percent span length of fifty-five millimetres, and a short fibre content below twenty-five millimetres of twenty-two point four percent.
These numeric differentials settle whether stock enters high-count wet-spinning channels or coarse dry-spinning production lines.
Purchasing contracts governed by standard trade rules mandate a maximum five percent deviation between declared upper half mean length and delivered lot optical profiles.

Drafting
Positioning of drawing rollers and faller bars on wet and dry spinning frames depends directly on optical length metrics. Roller gauge determines draft control. Incorrect distances lead to two distinct failure modes.
Setting front-to-back roller distances shorter than the two point five percent span length snaps extended technical bundles, creating short fibre debris and lowering yarn tenacity. Setting roller distances significantly wider than the maximum bundle length permits uncontrolled floating of unguided strands, generating thick and thin places known as draft waves.

Roller Gauge Adjustment Based on Span Length Ratios
Optimizing drawing frame settings requires exact matching of mechanical pin fields to measured span lengths. Gill boxes utilize faller bars equipped with steel pins to control short technical fibres as main drafting occurs. Pin density selection relies on the fifty percent span length parameter.
High short-fibre fractions demand denser pin layouts to prevent uncontrolled bundle acceleration into the front roller nip.
| Sliver Stock Grade | UHML Range (mm) | Front Roller Gauge (mm) | Gill Box Pin Density (pins/cm) | Max Draft Ratio |
|---|---|---|---|---|
| Extra Fine Hackled Line | 750 to 850 | 780 to 870 | 22 to 26 | 12.5 |
| Standard Hackled Line | 600 to 740 | 630 to 760 | 18 to 22 | 10.0 |
| Refined Combed Tow | 180 to 280 | 200 to 295 | 14 to 18 | 7.5 |
| Coarse Carded Tow | 80 to 160 | 105 to 175 | 8 to 12 | 5.0 |

Control of Nep Formation and End Breakage Rates
Fine yarns demand long bundles. Yield drops when fibre breaks. Correct setup procedures derived from optical profiler output protect sliver integrity across multi-passage drawing routines.
- Front roller ratching set to twenty millimetres beyond the two point five percent optical span length prevents fibre breakage in long line slivers.
- Fallers pin density selection matched to the fifty percent span length maintains control over short technical bundles during drafting.
- Roving twist multiplier setting adjusted according to short fibre content limits slubs in fine count wet-spun yarns.
Incorrect roller gauge settings based on unverified staple averages result in massive end breakage spikes and heavy yarn count variation across the spinning frame.


Ledger
Converting raw flax into saleable yarn involves precise commercial yield calculations based on maximum spinnable count limits. Metre cost correlates directly with target yarn count (Nm), where higher numbers represent finer yarns. A hackled line sliver exhibiting a two point five percent span length above seven hundred fifty millimetres and a short fibre content under three percent safely spins to wet-spun counts of Nm 60 up to Nm 100.
Lower-grade tow stock with short fibre fractions exceeding fifteen percent cannot maintain spinning stability beyond Nm 26 dry-spun, fundamentally altering the revenue potential per kilogram of delivered fibre.

Yarn Spinnability Limits Derived from Length Histograms
Consider a commercial production model evaluating a forty-tonne shipment of scutched flax priced at three euros and eighty cents per kilogram. Hackling operations yield sixty-two percent line sliver and thirty-eight percent comb tow. Invoices reflect delivered staple length.
High uniformity lowers spinning waste.
Optical length profiling on the hackled line fraction reveals an upper half mean length of six hundred eighty millimetres with a uniformity index of forty-four percent. This line sliver converts into wet-spun Nm 50 yarn at a spinning efficiency of ninety-two percent, producing thirty-eight thousand metres of yarn per kilogram of processed sliver. Fabric construction targets a finished weight of one hundred forty grams per square metre at a width of one hundred fifty centimetres.
The calculated yarn raw material cost component lands at ninety-four cents per linear metre of woven fabric.
High uniformity ratios in hackled line slivers reduce raw material consumption per targeted linear metre of high-count fabric.

Financial Impact on Finished Metre Landed Costs
If unmeasured short fibre content increases by four percent within the same line sliver lot, spinning efficiency drops to eighty-four percent due to elevated end-breakage rates. Spindle speed adjustments required to maintain frame operation drop output volume by twelve percent. The resulting raw material cost component jumps to one euro and fourteen cents per linear metre of finished woven fabric.
This twenty-cent increase per metre completely erodes net margins across high-volume weaving contracts.
Whether online high-speed optical scanning embedded directly inside drawing frames can eliminate manual comb sampling while maintaining calibration against heterogenous flax grades remains disputed across commercial spinning operations.