Laboratory Verification Methods for Flax Fibre Staple Length and Tenacity
Laboratory verification of flax staple length and tenacity requires calibrated clamp geometry, gravimetric tex determination, and strict climate control.

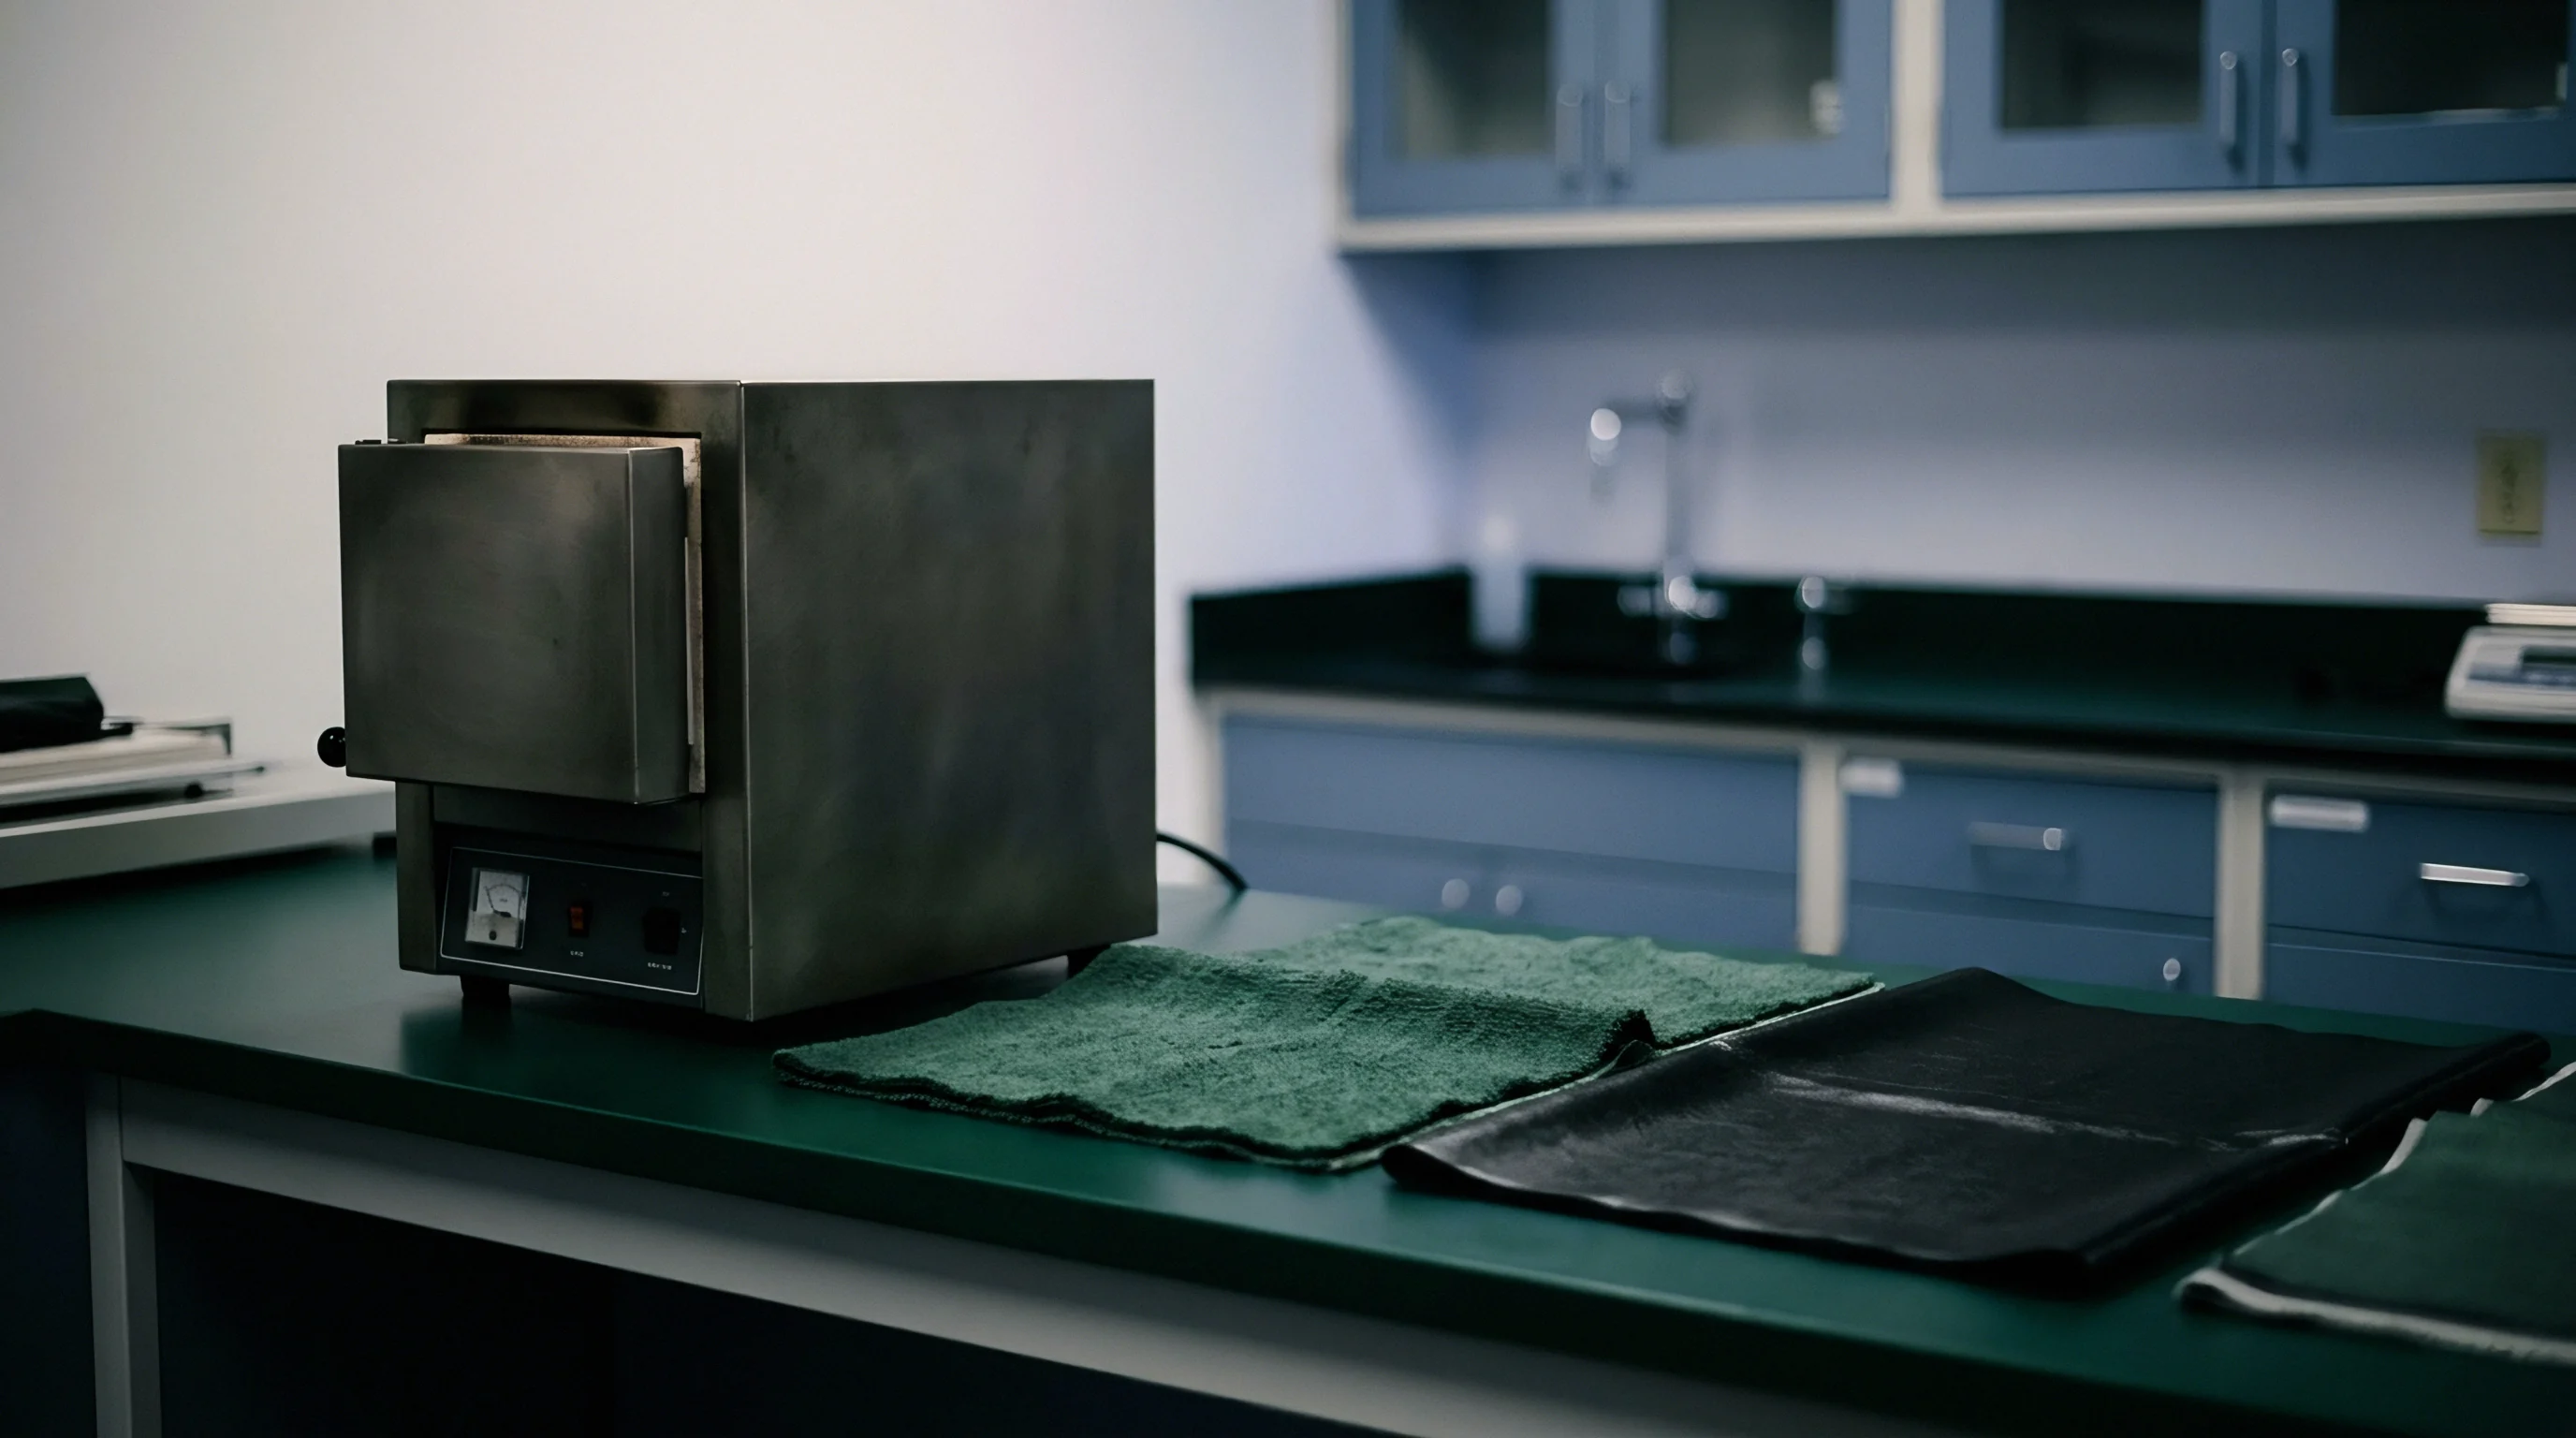
Clamp
Evaluating flax tensile behavior in the laboratory relies on precise jaw geometry to isolate true elementary and technical fiber strength. Synthetic filaments are uniform, but bast structures consist of bundled ultimate fibers held together by middle lamellae of pectin, hemicellulose, and lignin. Tensile testers record the force required to rupture these complex bundle networks, but mechanical gripping mechanisms introduce large errors if clamping pressure, jaw face inserts, and alignment parameters are improperly calibrated.
Soft surface inserts deform under load when clamping technical flax, whereas flat metal jaws induce stress concentrations that trigger premature failure right at the contact edge. Standardized test protocols require strict enforcement of clamping parameters to prevent fiber slippage while avoiding structural crushing of the pectin matrix before loading begins.
Pneumatic fixture assemblies utilizing smooth steel surfaces often cause slippage during high-load tensile evaluations of bast structures. Flat rubber-faced clamps accommodate bundle diameter variations, but elastomeric deformation allows longitudinal displacement within the grip zone as stress builds. This movement artificially inflates calculated strain values while reducing apparent tenacity readings.
Serrated leather inserts or polyurethane coated faces operating at pneumatic pressures between four and six bar eliminate axial movement without severing surface fibrils. Flat clamp faces require precision alignment within 0.02 millimeters across both lateral planes. Angular deviations cause uneven force distribution across the test bundle width, breaking peripheral fibers sequentially rather than loading the cross-section uniformly.
Jaw lining resilience directly dictates the fracture location profile across test series. Valid tensile measurements require clean ruptures occurring in the free gauge length between clamp boundaries.
Tensile testing performed without distance between hold points evaluates individual cell boundaries within the technical strand. Setting clamp faces directly against each other creates a nominal zero gauge length, where cell-to-cell adhesion and elementary fiber fracture operate simultaneously. Increasing clamp spacing to standard distances of 3.2 millimeters, 10 millimeters, or 20 millimeters shifts failure dynamics entirely toward weak-point distribution along the composite bundle length.
Longer test lengths expose structural flaws caused by aggressive mechanical scutching, over-retting, or localized fungal degradation. Evaluating tenacity across multiple gauge intervals generates a strength gradient curve that reveals structural internal cohesion.
Coarser technical bundle diameters shift break locations toward clamp contact points and conceal true single-element tensile limits.
Preparing specimens for tensile testing demands systematic comb alignment and mass control. Manual drafting removes loose, unaligned filaments and residual shive particles prior to clamping. Test sample mass must fall within tightly bounded linear density ranges, typically 1.5 to 2.5 tex for Pressley and Stelometer fixtures, or specified mass distributions for high-capacity universal testing instruments.
Bundles exceeding target linear densities exhibit internal shielding, where core fibers escape full clamping pressure and slip past outer layers during extension. Conversely, extremely sparse bundles suffer localized crushing under pneumatic jaw pressure. Testing speed also governs measured failure loads.
Constant rate of extension testing executed at 10 millimeters per minute produces distinct force curves compared to rapid pendulum break methods. Viscoelastic relaxation of the inter-cellular pectin matrix causes lower break forces at reduced strain rates, whereas high-speed impact loading overstates structural tenacity.
To execute a standardized zero-gauge tensile assessment for technical flax bundles, laboratory technicians adhere to a rigid preparation workflow:
- Extract representative fiber tufts from five distinct sample zones within the conditioned laboratory lot.
- Comb the extracted sample tufts through a fine-pin hand comb to eliminate short fibers, residual shive debris, and entangled neps.
- Draft the combed tuft manually until individual technical strands lie parallel without axial crossover or wave distortion.
- Trim the parallelized specimen to a fixed central length of 15 millimeters using a double-bladed cutting gauge.
- Weigh the trimmed bundle on an analytical balance to confirm mass falls within 2.0 milligrams plus or minus 0.2 milligrams.
- Mount the weighted bundle into special Pressley clamp assemblies tightened to a torque of 0.7 Newton-meters.
- Position the clamped assembly into the tensile tester and apply axial load until complete mechanical rupture occurs.
- Record the breaking force in Newtons and collect all broken fragments for verification of linear density.
Precision loading frames yield valid tenacity figures only when broken specimen distribution remains uniform. Tests exhibiting jaw break rates above ten percent indicate improper clamp alignment, incorrect pneumatic pressure setting, or damaged insert faces. Discarding jaw breaks maintains statistical validity, but high rejection rates flag systematic preparation errors that skew recorded median strength figures upwards.
Maintaining rigorous inspection of clamp faces prevents misinterpretation of bast fiber performance capabilities.
Choosing jaw linings with improper resilience causes premature fiber breakage inside the gripping area, artificially depressing reported tenacity figures by up to twenty percent and leading to the unnecessary rejection of high-grade line shipments.
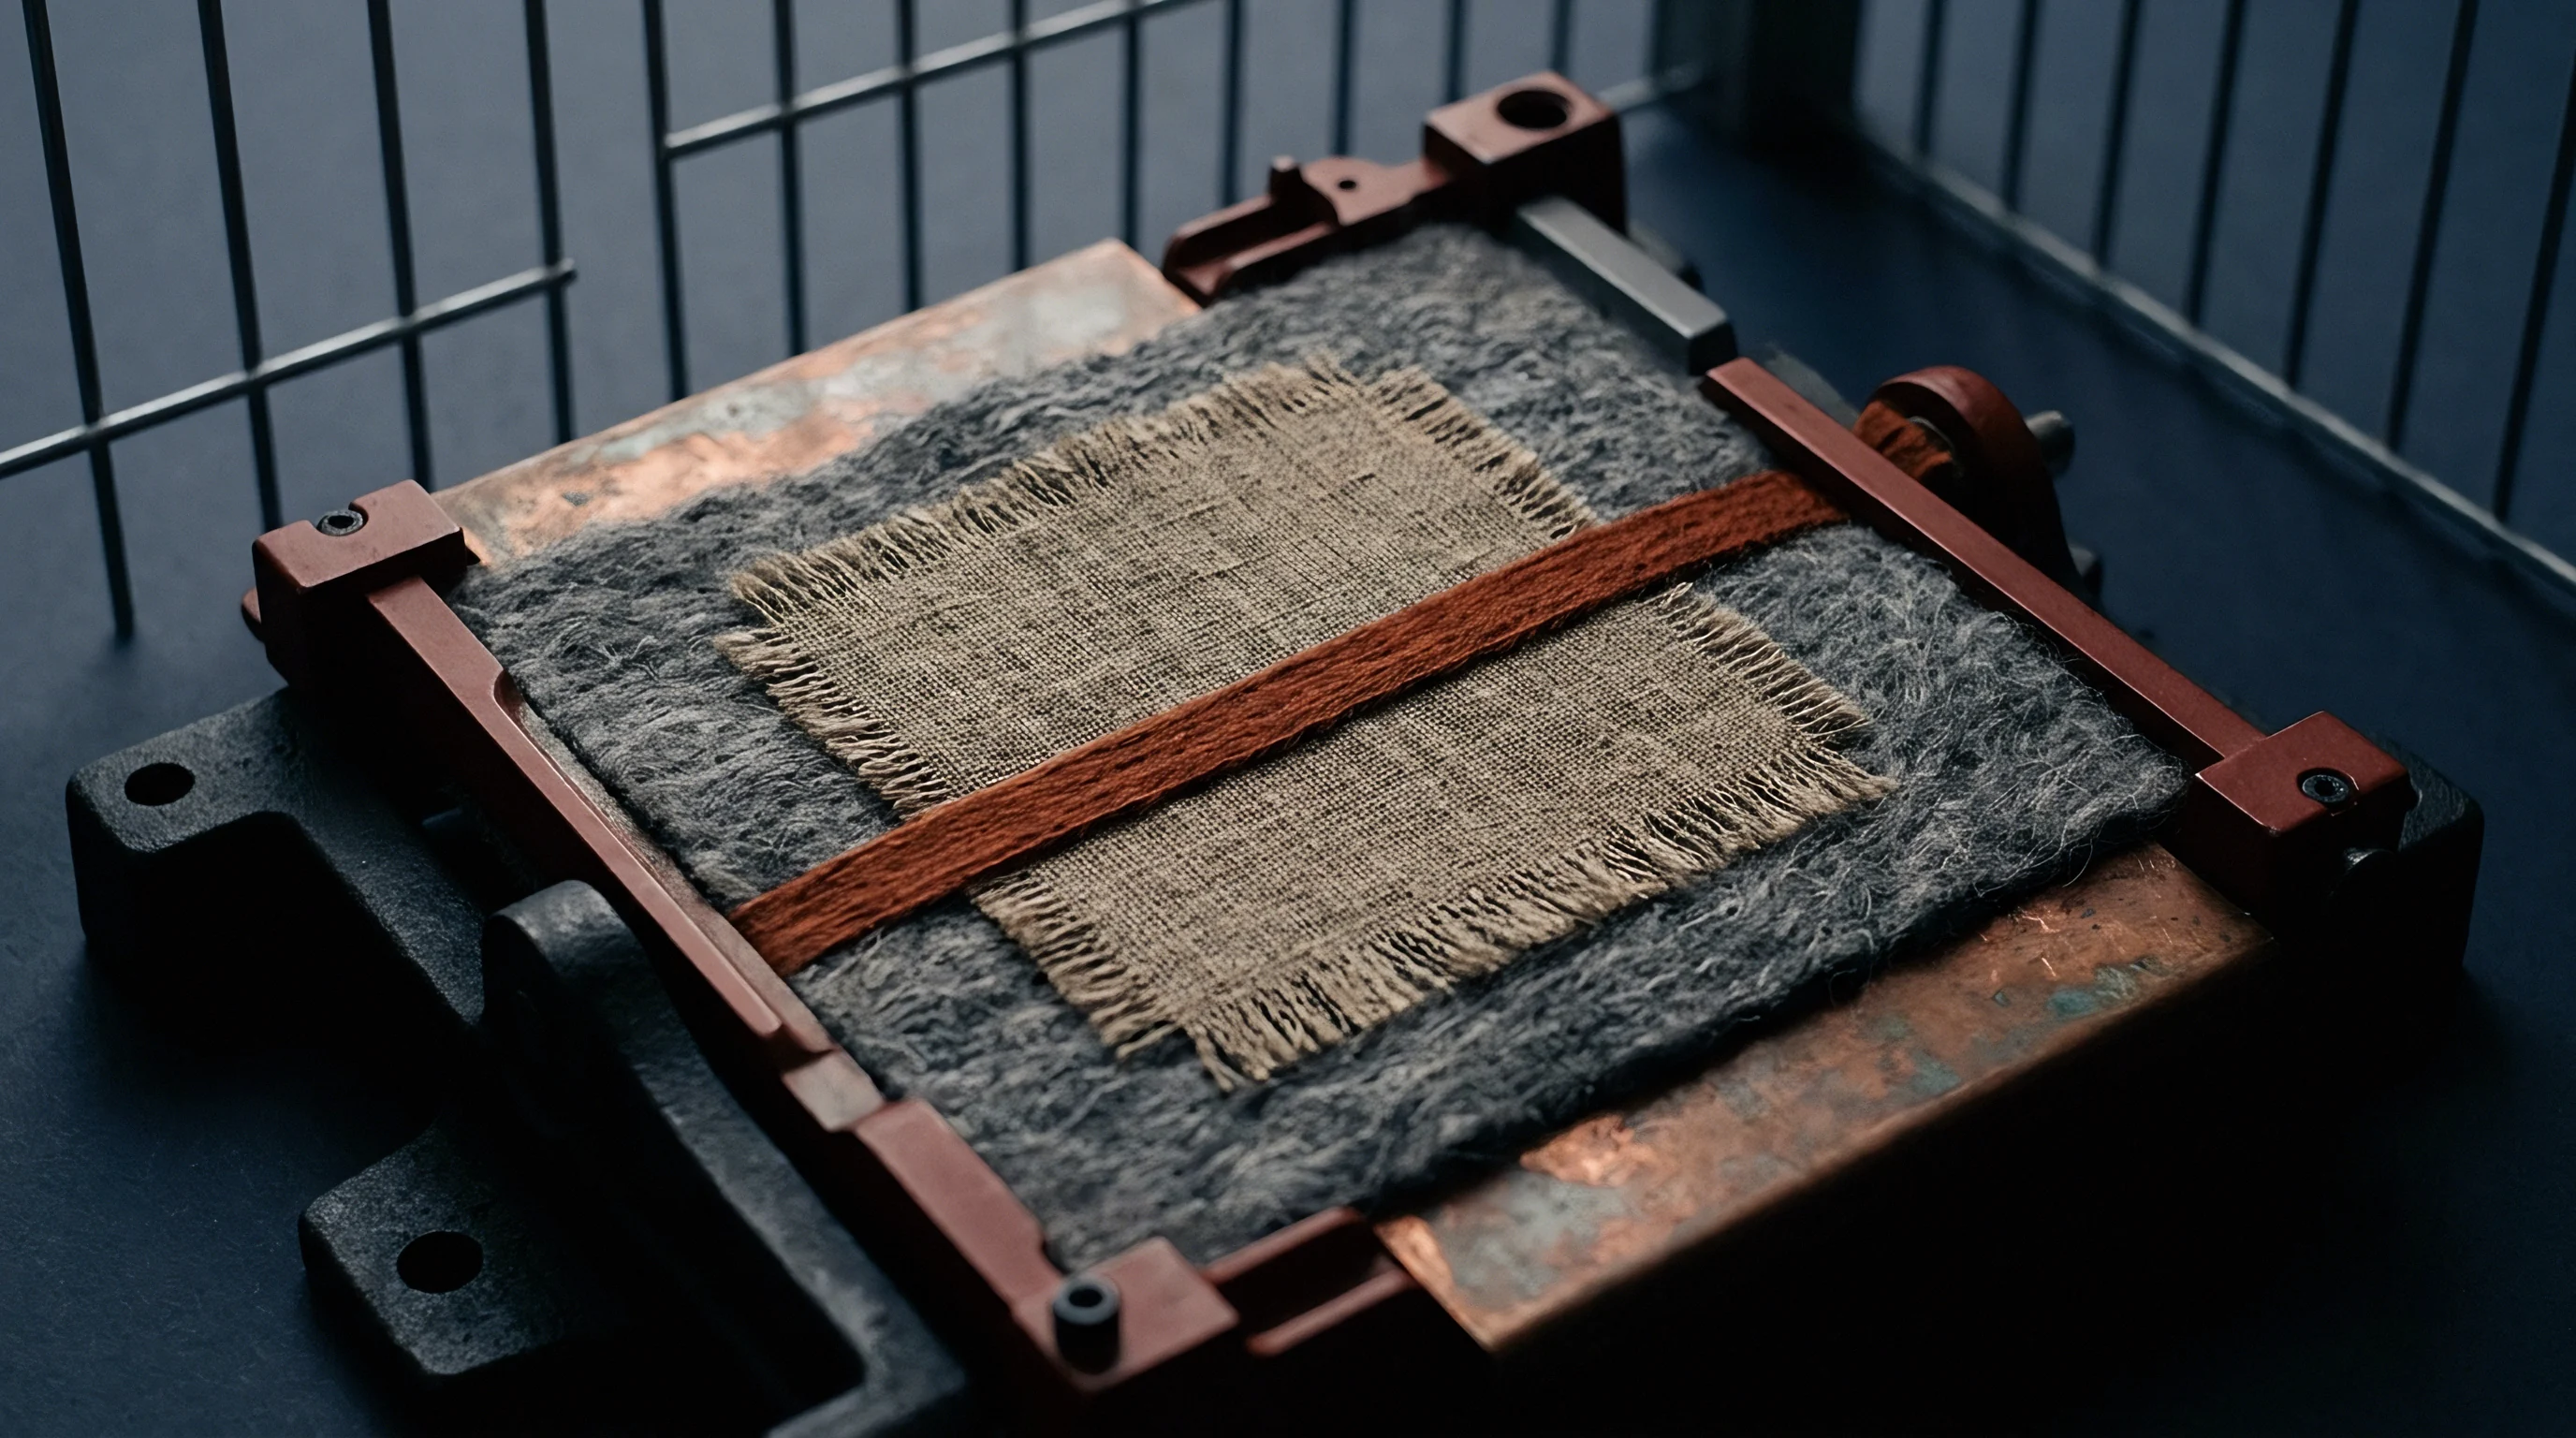
Sliver
Measuring flax length distributions requires separating complex elementary fiber bundles into individual measurable units without causing mechanical degradation. Raw bast fiber exists as long technical strands ranging from 300 to 900 millimeters in scutched line form, or as short, disordered tow fibers generated during hackling and scutching waste processing. Processing bast stock into draw-frame slivers breaks down bundle networks into shortened, parallelized assemblies.
Measuring length parameters across sliver specimens validates hackling efficiency and determines maximum draft capability on spinning frames. Fiber length distributions govern yarn evenness, count limits, and end-break frequency during dry or wet spinning operations.
Manual array preparation under standardized humidity conditions provides the primary baseline for mean fiber span determinations. Comb sorters, such as Johannsen-Zellweger or Durow-type comb assemblies, separate sliver fibers into discrete length classes through sequential manual combing and transfer routines. Technicians align fiber ends against a base baseline comb index, then draw out individual length fractions using broad-nosed fiber forceps.
Depositing these fractions onto velvet-covered sorting boards creates a classic tuft diagram representing true staple distribution. Calculating upper quartile length, mean length, and short fiber content from manual array diagrams demands exceptional operator skill. Manual comb sorting remains slow and labor-intensive, yet it avoids optical bias caused by variable fiber cross-sections or bundle splitting during automated scanning.
Automated benchtop sensors pass parallelized technical strands through light-blocking or dielectric fields to generate span length curves. Optical Almeter instruments measure light transmission through a combed fiber beard drawn through a photoelectric sensor slot. The resulting signal correlates directly with total fiber cross-sectional area, plotting a relative length distribution curve in minutes.
Modern capacitance instruments measure changes in electrical field density as sliver tufts move past sensor plates. Both automated methods require precise calibration against manual comb sorter standards established for specific flax processing streams. Flax fibers exhibit fluctuating moisture content, variable pectin thickness, and irregular ribbon shapes, which distort optical and capacitive signals if calibration models rely strictly on round, uniform synthetic geometries.
| Test Parameter | Comb Sorter (ISO 6989) | Optical Almeter (ISO 16565) | Image Analysis (Automated) |
|---|---|---|---|
| Sample Mass Requirement | 5.0 grams +/- 0.5 g | 1.0 gram +/- 0.1 g | 0.2 grams +/- 0.02 g |
| Preparation Time Per Sample | 45 to 60 minutes | 8 to 12 minutes | 15 to 20 minutes |
| Length Measurement Range | 5 mm to 500 mm | 10 mm to 350 mm | 1 mm to 200 mm |
| Measurement Resolution | 2.5 mm classes | Continuous profile | 0.1 mm optical resolution |
| Operator Skill Dependence | Extremely high | Moderate | Low to moderate |
| Sensitivity to Fiber Crimp | Negligible | Moderate bias | High bias if unaligned |
Discrepancies between manual comb sorter distributions and optical length determinations stem primarily from variable fiber crimp and residual pectin cohesion.
Length parameters directly influence drafting mechanics within drawing and roving frames. Long, uniform line flax fibers enable high draft ratios without introducing drafting waves or periodic yarn thickness variations. When short fiber content below 25 millimeters exceeds contract specifications in hackled line slivers, floating fibers move uncontrollably through the drafting zone, creating thick and thin places in the spun roving.
Image analysis systems now capture high-resolution digital profiles of individual fibers spread across transparent glass plates. Specialized software algorithms separate overlapping technical strands, measuring true centerline length, fiber curvature, and branching indices. Digital image analysis isolates elementary fiber dimensions after chemical degumming, providing ultimate cell length distributions alongside technical bundle lengths.
Failure modes in length verification often originate from sample damage during preparation or incorrect instrument calibration:
- Aggressive Combing Degradation occurs when dense, unretted sliver tufts are drawn through comb pins too rapidly, snapping long technical fibers and artificially skewing short fiber percentages upward.
- Optical Shadow Distortion arises when bundle clusters pass through Almeter measurement slots, causing dense multi-fiber groups to register as single oversized fibers.
- Humidity Drift Discrepancy happens when testing occurs outside standard climate limits, causing dry bast fibers to become brittle and break during manual array extraction.
- Zero-Baseline Drift develops in capacitive measurement systems when residual dust and shive particles accumulate on sensor plates, altering baseline dielectric readings across test series.
Accurate length metrics enable yarn technologists to balance hackling yield against final spinning performance. High hackling extraction removes short fibers to maximize sliver staple length, but excessive tow removal inflates raw material costs per kilogram of finished yarn. Laboratory length verification provides the quantitative feedback loop needed to optimize comb pin densities, speed ratios, and draw-frame roll settings.
Technical bundles that exhibit soft, fully retted terminal tips yield wider comb distributions than hard unretted stock, regardless of physical strand span.


Gauge
Quantifying flax fineness demands exact calibration of linear density, as fiber mass directly scales tensile calculations. Flax linear density is expressed in tex, representing mass in grams per 1,000 meters of strand length, or millitex for fine technical filaments. Because bast fibers display highly irregular cross-sections ranging from polygonal elementary cells to broad ribbon-like composite bundles, geometric diameter measurements using optical microscopes introduce substantial error.
Gravimetric methods remain the primary reference standard for determining true linear density in bast fiber evaluation. Accurate mass determination forms the foundation of all tenacity calculations, expressed as breaking force per unit linear density in centinewtons per tex.
Sectioning bundle samples to precise millimetric dimensions establishes the true tex value required for tenacity calculations. Technicians clamp parallelized fiber bundles into dual-blade cutting fixtures spaced at known distances, such as 10 millimeters or 20 millimeters. Cutting both ends simultaneously produces uniform length specimens.
Counting the exact number of individual strands under magnification, followed by mass determination on a microbalance sensitive to 0.001 milligrams, yields absolute mean linear density. Airflow instruments, calibrated for cotton or wool fineness, require modified constants when assessing flax tow slivers due to variable lumen size, internal voids, and surface roughness of bast bundles. Gravimetric sectioning avoids these structural calibration errors.

Does Dynamic Single Fiber Gauge Measurement Predict Yarn Strength?
Individual elementary cell tests isolate intrinsic polymer integrity, yet spinning performance correlates more closely with bundle cohesion during drafting. Dynamic single fiber testing systems, such as Favimat micro-tensile testers, combine automated linear density measurement via resonance frequency methods with single-element force-elongation loading. The instrument vibrates individual mounted fibers to determine exact linear density continuously before applying axial force to measure breaking strength and modulus.
While single-cell data isolates cellulose microfibrillar performance, commercial yarn strength relies on inter-fiber friction and middle lamella shear resistance within technical bundles. Single-element testing complements bundle tenacity assays without replacing them.
| Processing Grade and Origin | Linear Density (tex) | Zero-Gauge Tenacity (cN/tex) | 3.2 mm Gauge Tenacity (cN/tex) | Elongation at Break (%) | Retting Degree (Pectin Content %) |
|---|---|---|---|---|---|
| Dew-Retted High-Grade Line (France) | 1.6 to 2.2 | 52.0 to 65.0 | 38.0 to 46.0 | 2.1 to 2.8 | 1.8 to 2.4 |
| Water-Retted Premium Line (Historical Ref) | 1.4 to 1.9 | 58.0 to 72.0 | 44.0 to 52.0 | 2.4 to 3.1 | 1.2 to 1.6 |
| Dew-Retted Standard Tow (Belgium) | 2.8 to 4.5 | 35.0 to 45.0 | 22.0 to 30.0 | 1.8 to 2.3 | 2.8 to 3.5 |
| Enzyme-Treated Hackled Line (Trial) | 1.8 to 2.4 | 48.0 to 58.0 | 32.0 to 40.0 | 1.9 to 2.4 | 1.5 to 2.0 |
| Cottonised Unbleached Tow (China) | 0.4 to 0.8 | 28.0 to 36.0 | 18.0 to 24.0 | 4.5 to 6.2 | 0.8 to 1.2 |
Application of ISO 2370 gravimetric sectioning rules invalidates tensile test certificates where individual technical fibre lengths fall below 20 millimetres.
Fineness variations alter force transmission efficiency inside wet-spinning and dry-spinning operations. Finer technical fibers offer larger surface area per unit mass, increasing inter-fiber contact points within the twisted yarn structure. This added friction prevents fiber slippage under tensile load, enabling higher spinnable metric counts from equivalent raw stock.
Gravimetric sectioning validates pneumatic fineness measurements. Standard testing environments maintained at 20 degrees Celsius plus or minus 2 degrees, and 65 percent relative humidity plus or minus 4 percent, are mandatory for density and tenacity testing. Dry flax fibers lose flexibility and exhibit reduced breaking elongation, whereas excessively humid specimens report inflated tenacity due to moisture-induced plasticization of cell walls.
Standard quality verification protocols for incoming bast fiber lots enforce strict compliance checks prior to invoice settlement:
- Sampling Stratification Protocol verifies that specimens are drawn from at least ten percent of delivered bales across top, middle, and bottom core positions.
- Environmental Conditioning Audit checks that samples underwent a minimum 24-hour equilibration period inside an ISO 139 compliant climate chamber before testing.
- Linear Density Verification Metric mandates that linear density calculations rely on direct gravimetric mass measurement of trimmed bundle centers rather than indirect pneumatic estimate models.
- Gauge Length Standard Enforcement ensures that recorded tenacity figures specify exact clamp spacing, test speed, and pre-tension values applied during evaluation.
- Jaw Fracture Rate Threshold requires immediate test series invalidation if more than ten percent of breaks occur within 1.0 millimeter of clamp boundaries.
Understanding linear density dynamics prevents misinterpreting material performance. Coarse fiber bundles displaying high breaking force often register lower tenacity than fine bundles that break at smaller absolute loads, because tenacity normalizes force against fiber mass. Technologists must cost raw material based on tenacity and fineness combined, rather than absolute breaking load alone.
Reduced tenacity values may stem from aggressive laboratory combing or structural micro-cracking sustained during industrial scutching.
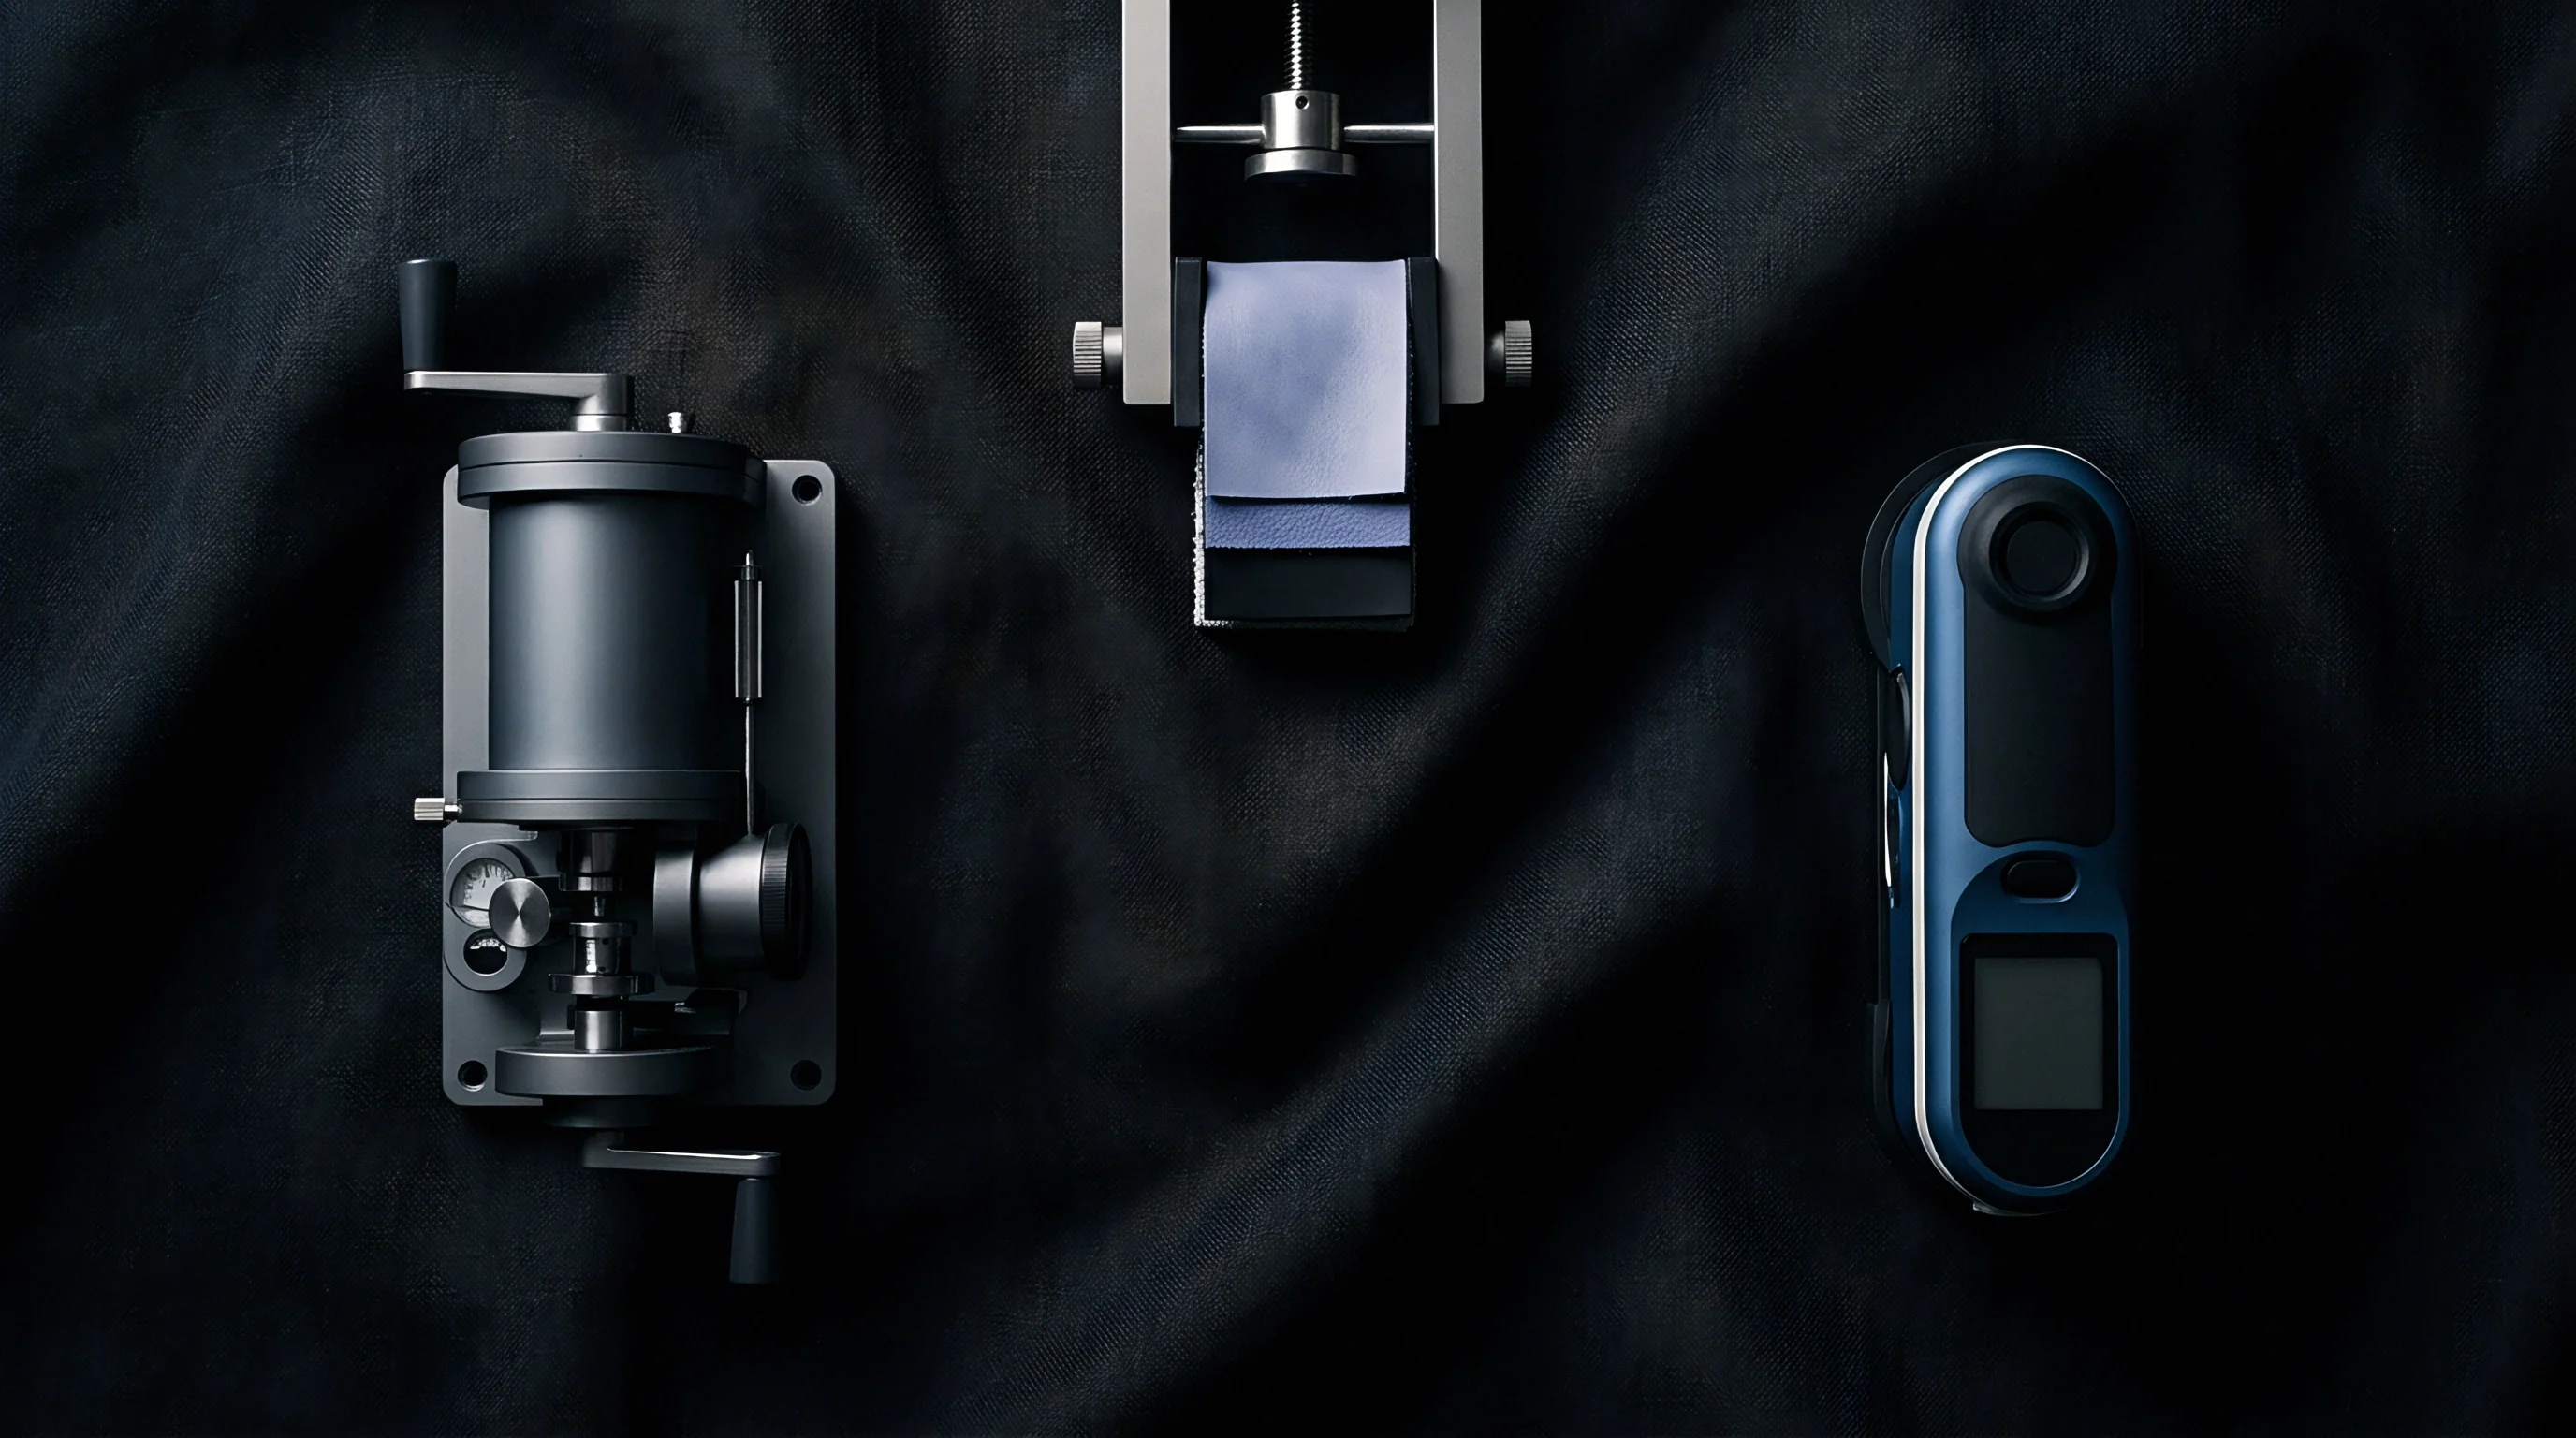
Variance
Bast fiber populations inherently display substantial dispersion in physical dimensions due to biological growth conditions and uneven retting action. Unlike synthetic filaments extruded through precision spinnerets, natural flax fibers cut from field crop stems exhibit broad variation in wall thickness, elementary cell length, and middle lamella composition. Technical strands extracted from stem base sections differ significantly in linear density and tenacity compared to strands harvested from middle or top stem zones.
Laboratory verification protocols must quantify statistical variance across multiple test series to separate true material quality signals from random sampling noise. Reporting mean tenacity or mean staple length without providing coefficient of variation figures leaves yarn buyers vulnerable to processing failures.
Statistical analysis of failure probabilities across varying clamp distances reveals the structural defect frequency within technical strands. Weibull distribution models effectively describe the brittle strength dispersion of bast fibers. The two-parameter Weibull model utilizes a shape parameter, known as the Weibull modulus, alongside a characteristic scale parameter representing baseline material strength.
A high Weibull modulus indicates structural uniformity and low defect density across the fiber lot, resulting in predictable yarn processing behavior. Conversely, a low Weibull modulus flags severe structural damage caused by over-retting, aggressive scutching pin impact, or localized decay during field retting. Calculating Weibull parameters from zero-gauge and finite-gauge tensile test series enables lab technicians to quantify weak-link frequency along composite technical strands.
Extracting representative specimens from dense commercial bales requires stratified randomized selection across internal core sections. Drawing fibers only from outer bale surfaces introduces sampling bias, as exposed fibers undergo moisture exchange and mechanical abrasion during transport. Standard sampling guidelines require opening selected bales, removing outer layers, and extracting core tufts from multiple internal points.
Blending these tufts into a master composite sample ensures that laboratory sub-samples accurately reflect full lot characteristics. Acceptance thresholds are established by calculating the coefficient of variation across ten distinct draw-frame slivers. High length coefficient of variation values indicate poor hackling comb settings, leading to excessive drop-out waste and count variations on spinning frames.
Quantifying test sample sizing rules prevents costly false-positive lot rejections or unearned supplier approvals. Because bast fiber property dispersion is inherently wide, small sample sizes yield unstable statistical estimators. Measuring five fiber bundles provides virtually no confidence regarding lot mean tenacity.
Standard protocols mandate evaluating a minimum of 30 to 50 replicate bundle breaks for Pressley or Stelometer determinations, and up to 100 individual test specimens for single-element automated tensile evaluations. Calculating the standard error of the mean for each lot parameter establishes confidence intervals around reported test values.
Discrepancies between laboratory test reports and actual spinning mill performance often trace back to omitted statistical metrics in commercial documentation:
- Tenacity CV Percentage Threshold dictates that long-staple line flax shipments exhibiting strength variation above 18 percent trigger secondary qualification testing prior to spinning.
- Length Distribution Skewness Index measures asymmetry in staple length curves, highlighting excess short fiber fractions that create drafting waves during yarn formation.
- Weibull Modulus Limit establishes a minimum acceptable Weibull shape factor of 3.2 for premium line flax intended for high-count wet-spun yarns.
- Outlier Rejection Rules prohibit arbitrary elimination of low-strength test values unless verified mechanical jaw failure or sample misplacement occurred during testing.
Statistical variance directly impacts spinning mill economics through yield losses and yarn quality downgrades. Fiber lots exhibiting high staple length variance generate increased noil and tow waste during comber and draw-frame processing. In flexible wet-spinning mills, irregular tenacity distributions cause frequent end breaks in the spinning trough, forcing operators to drop spindle speeds and reduce frame efficiency.
High end-break rates increase labor costs per kilogram of yarn while introducing splices and knots that lower final fabric market value. Incorporating rigid statistical limits into fiber purchasing specifications transforms laboratory test data into an effective risk-management mechanism.
Documenting verification results requires structured reporting layouts that capture environmental conditions, sampling parameters, test instrument configurations, and statistical summary metrics. Standard laboratory documentation must include complete raw data arrays alongside calculated statistical parameters to enable independent verification by third-party reference laboratories during commercial disputes.
Complete laboratory verification reports for bast fiber shipments must incorporate essential testing parameters and statistical summary data:
- Sample Traceability Record detailing commercial lot identifiers, bale numbers, harvest origin, retting method, and sampling date.
- Conditioning Environmental Log documenting continuous chamber temperature and relative humidity recordings throughout the 24-hour pre-test equilibration period.
- Instrument Calibration Certificate specifying recent calibration dates, reference load cell verification metrics, and jaw alignment clearance records.
- Gravimetric Fineness Data presenting specimen length, measured bundle mass, strand count, and calculated tex values for each test series.
- Tensile Strength Profile listing individual break loads, calculated tenacity values in cN/tex, gauge length settings, and extension rates.
- Statistical Summary Array presenting calculated mean values, standard deviations, coefficient of variation percentages, and calculated 95 percent confidence intervals.
- Failure Location Distribution categorizing break sites as mid-gauge, near-clamp, or within-jaw to confirm test validity across specimen series.
- Weibull Distribution Parameters detailing shape and scale factors derived from multi-gauge tensile testing series where required by technical specifications.
Dew-retted line flax tested at 21 degrees Celsius and 65 percent relative humidity exhibits mean bundle tenacity values between 45 and 58 centinewtons per tex at a zero gauge length.
Rigorous verification procedures eliminate ambiguities that create friction between fiber merchants and yarn spinners. When quality certificates report standard deviation alongside median property values, spinners can adjust draft distributions and frame speeds before loading material onto production lines. Proactive adjustments based on laboratory variance profiles reduce mill downtime and protect yarn margin structure.
The industry continues to debate whether automated single-cell acoustic pulse velocity measurements can fully replace destructively tested bundle tenacity assays for high-speed wet-spinning quality assurance.
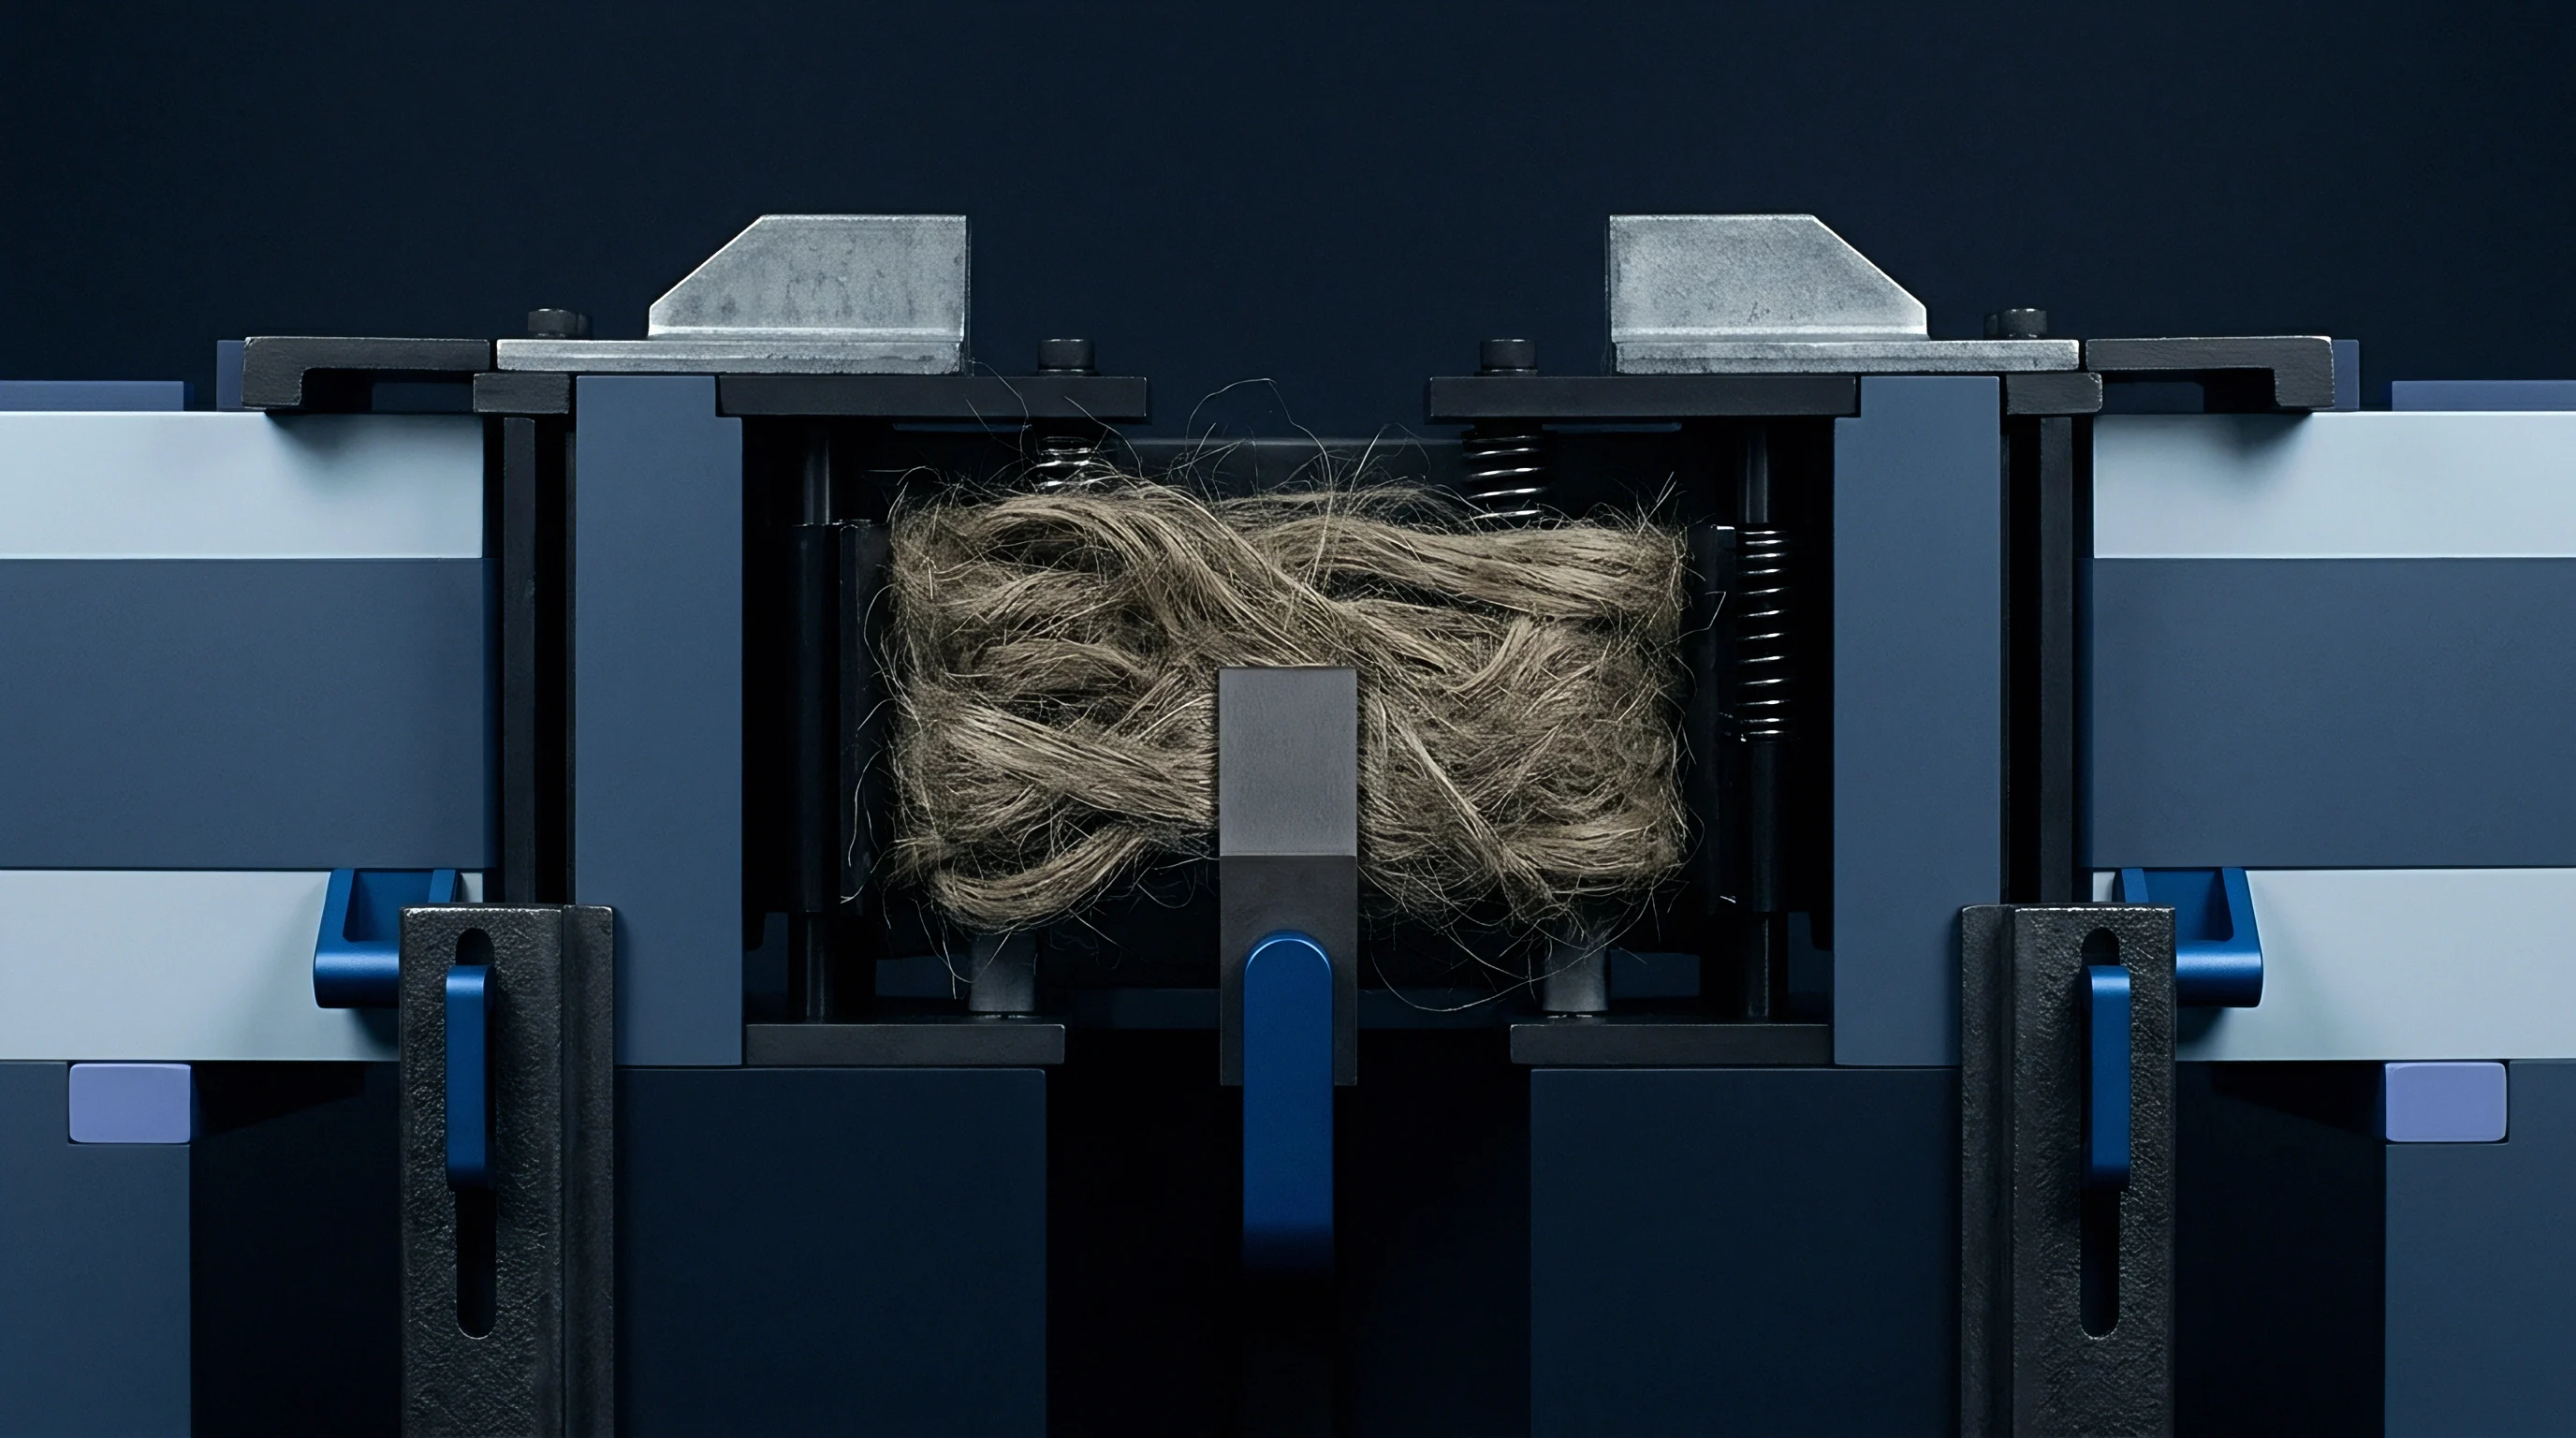
Audit
Commercial procurement contracts for long-staple flax convert bench test metrics into binding economic parameters that govern mill yield. Raw bast fiber purchases represent the single largest variable cost component in linen yarn manufacturing. Buyers must evaluate offer sheets through a clear yield-calculation framework that translates raw fiber length, tenacity, fineness, and trash content into the true landed cost per kilogram of spinnable sliver.
Accepting fiber lots based solely on nominal raw material price per kilogram without verifying laboratory tenacity and length profiles exposes spinning mills to severe margin erosion caused by low hackling yields and high yarn break rates.
Hackling room losses increase rapidly when short fiber fractions exceed baseline contractual allowances. Long-staple scutched flax passes through multi-stage hackling pins to parallelize fibers and extract hackling tow, shive debris, and short filaments. High-grade line flax with uniform staple length yields between 60 and 68 percent hackled line sliver, with the remaining mass converted into lower-value hackling tow.
If delivered fiber lots contain excessive short fiber or exhibit low bundle tenacity due to over-retting, hackling yield drops below 52 percent. This shift diverts valuable raw material mass from line sliver streams into discount-priced tow fractions, inflating effective raw material cost per kilogram of line sliver by up to 25 percent.
To protect spinning performance, technical procurement terms integrate minimum strength requirements. Fibre tenacity directly dictates maximum spinnable yarn count. High-count wet-spun yarns, such as Lea 60 or Lea 80 used for fine apparel fabrics, require line flax exhibiting zero-gauge bundle tenacity above 55 centinewtons per tex and linear density finer than 1.8 tex.
Attempting to spin fine counts from lower-tenacity fiber causes excessive end breaks in the wet-spinning trough, forcing operators to downgrade frame speeds or reduce target yarn count. Dry-spinning routes for coarse carpet yarns or technical textiles can absorb lower tenacity tow fibers, but pricing structure must reflect reduced processing capability.
| Fiber Grade Specification | Baseline Raw Fiber Cost ($/kg) | Lab Tenacity (cN/tex @ 3.2mm) | Hackled Line Yield (%) | Effective Sliver Cost ($/kg) | Target Yarn Count (Metric Nm / Lea) | Landed Metre Fabric Cost ($/m) |
|---|---|---|---|---|---|---|
| Premium Dew-Retted Line (Grade A) | 5.20 | 42.5 | 66.0 | 7.88 | Nm 39 / Lea 68 | 4.15 |
| Standard Dew-Retted Line (Grade B) | 4.40 | 35.0 | 58.0 | 7.59 | Nm 26 / Lea 44 | 3.85 |
| Low-Tenacity Over-Retted Line (Grade C) | 3.80 | 26.5 | 48.0 | 7.92 | Nm 15 / Lea 26 | 4.62 |
| Combed Hackling Tow (Grade T1) | 2.60 | 24.0 | 82.0 (Combed) | 3.17 | Nm 10 / Lea 17 | 2.95 |
| Note: Landed metre fabric cost calculated for plain weave linen fabric (180 g/m² nominal weight, 150 cm finished width), incorporating spinning waste, frame efficiency loss, and weaving conversion costs. | ||||||
Financial analysis proves that lower raw fiber purchase prices frequently produce higher finished fabric costs when tenacity and length distributions fail verification standards. Grade C line flax purchased at a 27 percent discount relative to Grade A raw stock generates higher effective sliver cost ($7.92/kg vs $7.88/kg) due to severe hackling yield loss. Furthermore, reduced bundle tenacity restricts spinning to coarse Nm 15 yarn counts, resulting in heavier, lower-value fabrics with inflated landed metre costs.
Commercial audit frameworks rely on laboratory test certificates to settle price adjustments or enforce batch rejections before fiber enters production routines.
Formal delivery agreements incorporate standard testing tolerances to manage financial remedies for out-of-spec deliveries. Quality clauses must reference specific international standard test methods, sample selection protocols, and authorized independent reference laboratories. Contracts should define price deduction scales linked to linear density deviations, short fiber content increases, and tenacity shortfalls.
Establishing clear technical parameters inside purchase orders transforms bench testing into an authoritative commercial verification tool.
Inclusion of standard international arbitration terms specifying mandatory re-testing at independent reference laboratories under ISO 139 environmental conditions shifts the financial burden of false quality claims back to the issuing vendor.