Determining Flax Staple Length and Profile Metrics Using Manual Comb Sorting Methods
Manual comb sorting isolates true flax bundle length arrays, determining Upper Quartile Length and Short Fibre Content to set mill drafting ratches.
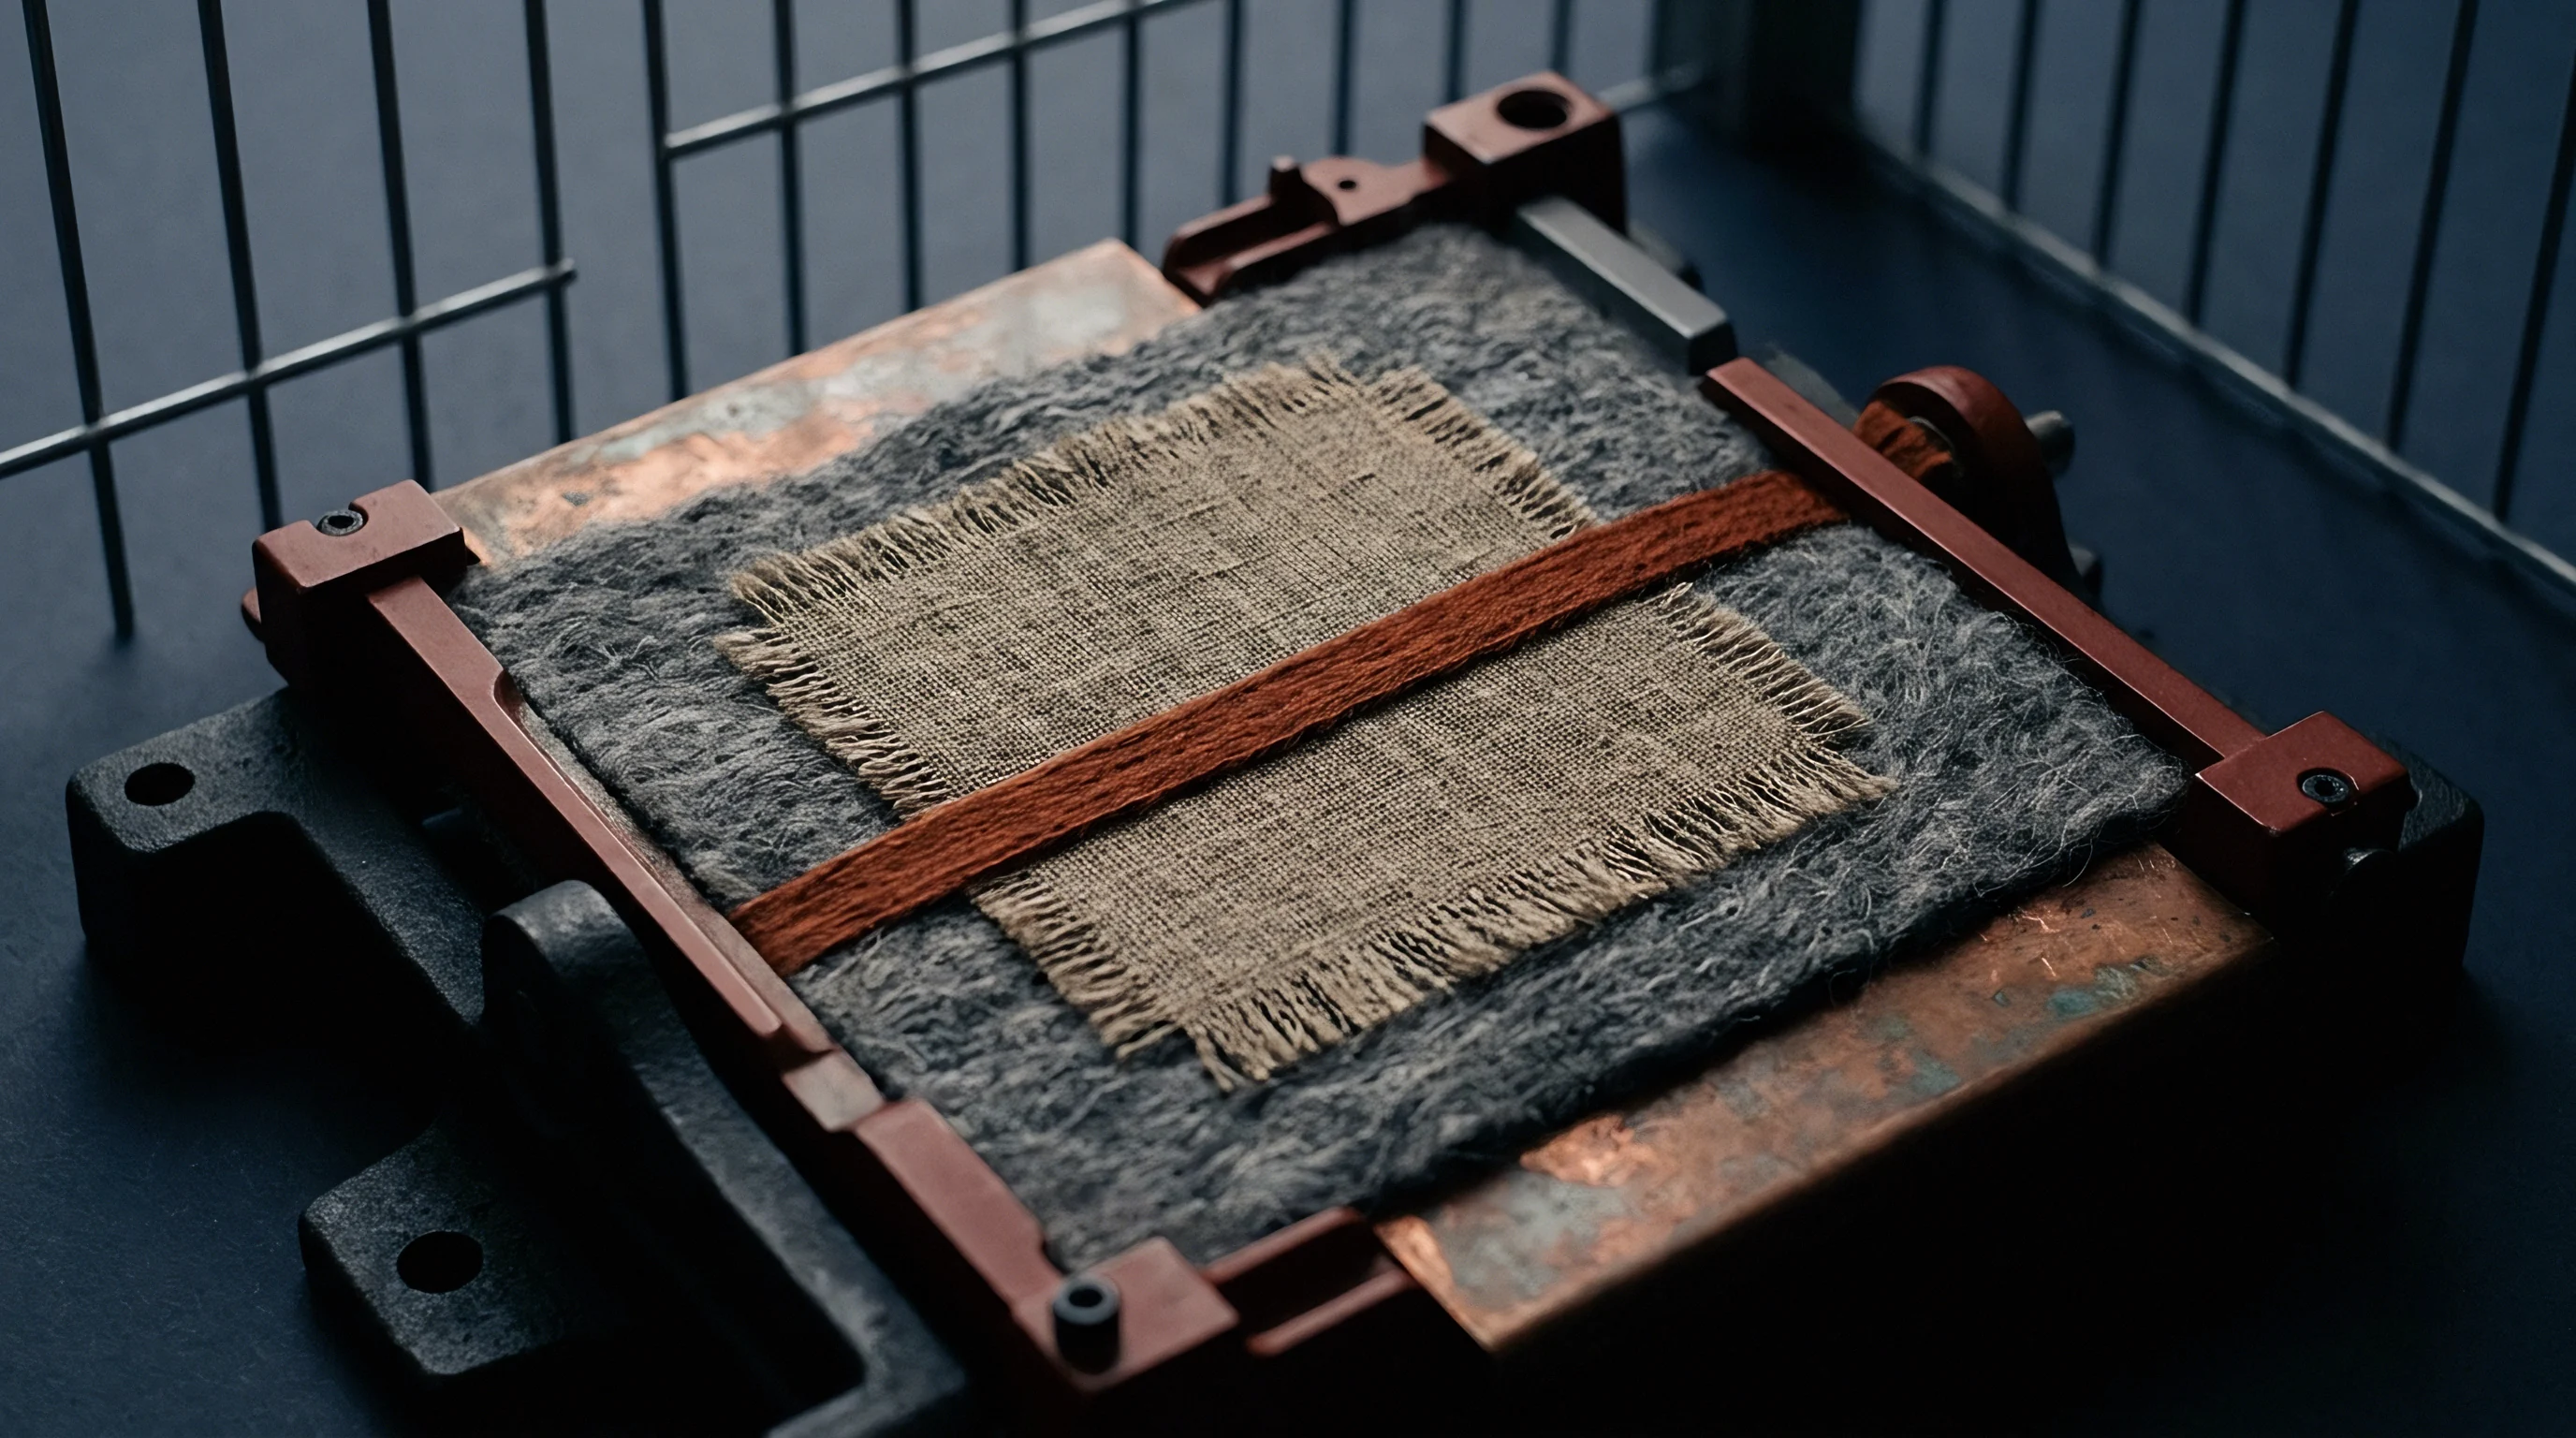
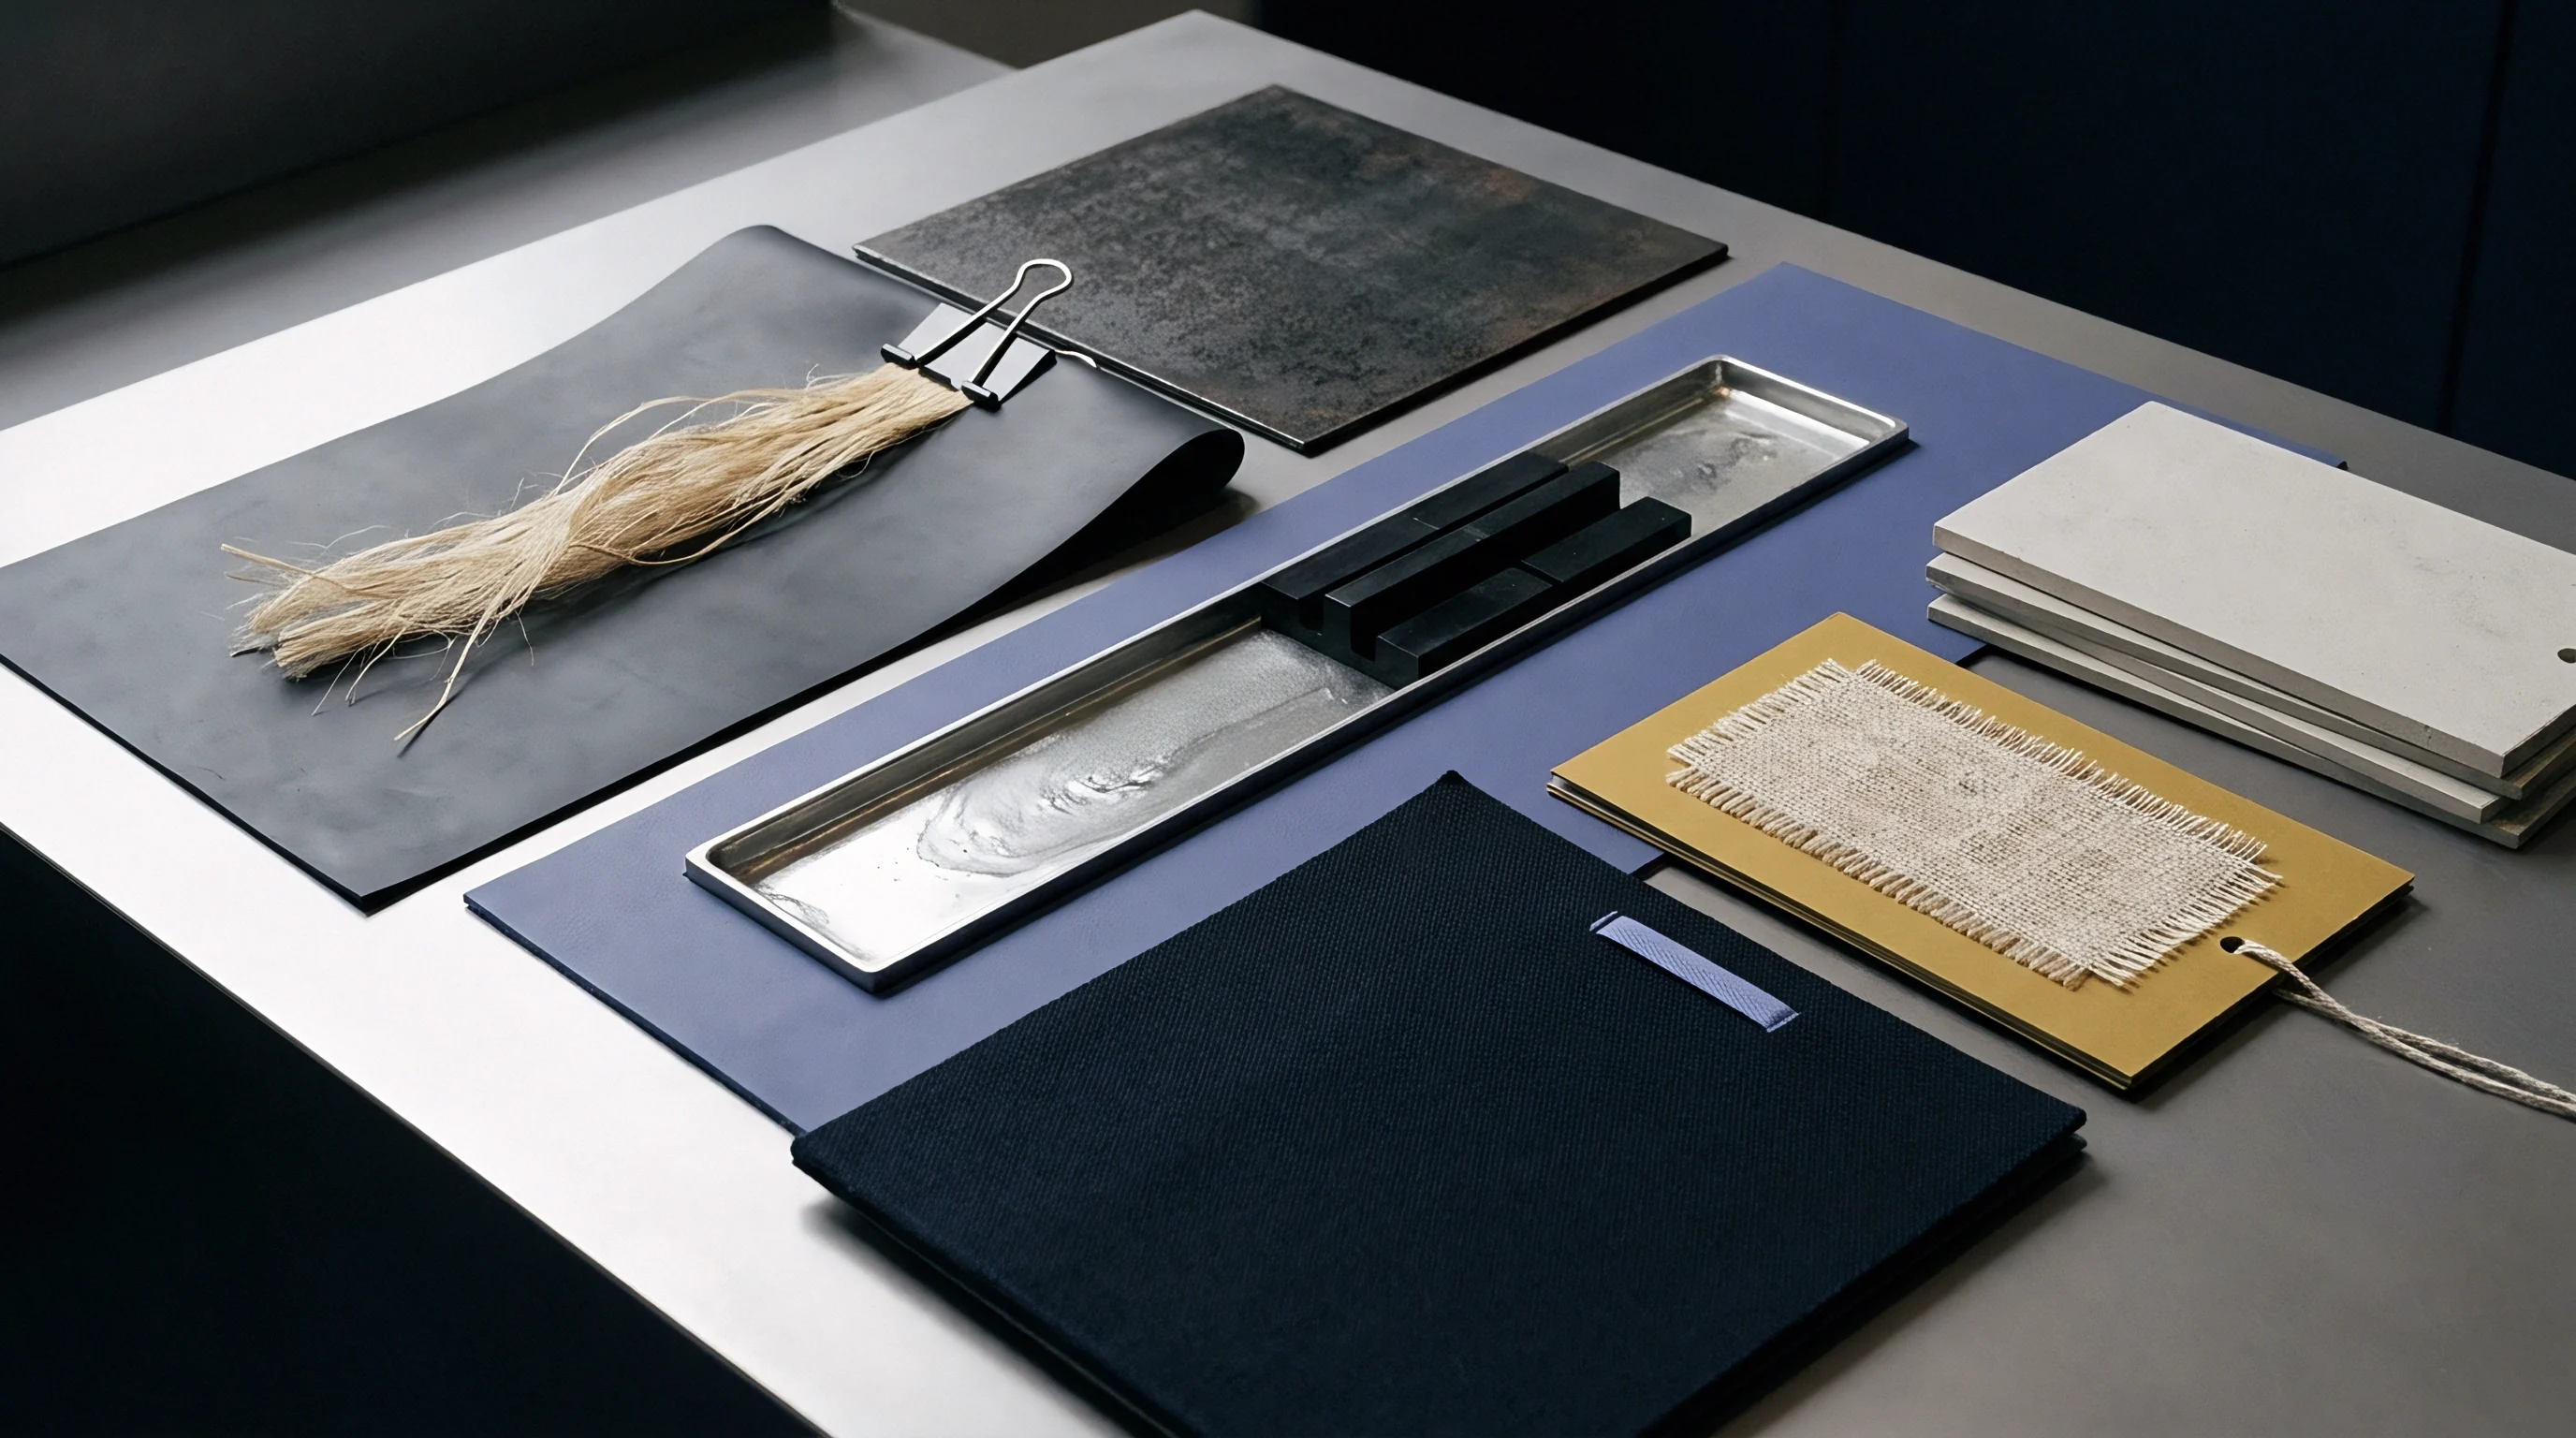
Tuft

Physical Structure of Flax Technical Fibres
Bast fibre architecture complicates measurement in ways cotton never does. Unlike single-cell cotton hairs with their relatively predictable length envelope, flax bundles consist of elementary cells held together by interlamellar pectin, lignin, and hemicellulose. The material reaches manual comb sorting as a shifting mix of broad technical bundles and partly split sub-units.
Scutching, carding, and hackling shear these pectinate bonds at every turn, continuously shifting the staple profile along the mill line. Any meaningful length measurement therefore depends on establishing a uniform degree of mechanical split before pins ever touch the sample.
Dry comb sorting separates these profiles by drawing aligned strands through a dual-bank pin bed. The operator clamps projecting fibre ends held in fine steel needles and pulls them forward in descending length classes. This mechanical isolation avoids the optical reflection errors common to bast testing, where uneven bundle thickness, variable retting, and dark coloration deceive automated instruments.
High-speed optical systems frequently register heavy, dark bundles as single short fibres, or read overlapping light bundles as artificial long staple. Manual sorting isolates each fraction as pure mass, weighed directly on a microbalance.
Standard test conditions at 20 degrees Celsius and 65 percent relative humidity dictate flax fibre moisture regain prior to comb array fractionation.

Specimen Cohesion and Fibre Separation Limits
The manual method is intended specifically for hackled line flax, carded flax tow, and cut staple prepared for short-staple ring or open-end spinning. Unhackled stricks run to coarse composite bundles well over 500 millimetres, far beyond the 200 to 300 millimetre reach of standard double-bank beds. Sorting scutched long flax demands specialized tall-pin equipment or manual bench-draw techniques; forcing heavy line fibre through a standard cotton sorter will bend needles, shear bundles along the pin line, and create an entirely false short-fibre reading.
Pectin cohesion dictates how bundles behave during the draw. Over-retted straw separates under minimal pin draft, generating fine technical bundles but shortening the apparent length profile as fragile nodes snap under tension. Under-retted flax resists the combs altogether, leaving thick, stiff bundles that ride high on the pins and slip unevenly through the clamp.
Operators gauge draw force and needle penetration against reference samples to avoid pulling fibres in two. Bundles must come out straight along their axis, with zero lateral twist.
These length distributions directly govern how the lot runs on the floor. The profile sets the maximum spinnable Lea or metric count, determines the drafting ratch distance, and controls finished yarn hairiness. If blended tow streams introduce a bimodal distribution, drafting waves develop in wet spinning, producing repeating thin and thick sections.
Sorter arrays isolate this numerical profile clearly, exposing short-fibre fractions before they cause spinning ends-down.
Whether automated image analysis can ever fully replace manual comb sorting for pectin-bound bast fibres remains uncertain due to persistent optical overlapping errors in un-retted technical bundles.


Bench

Apparatus Configuration and Pin Bed Geometry
Accurate sorting requires a dual-bank manual unit fitted with hardened steel pins set into machined brass beds. The classical duplex sorter uses two opposed, identical comb banks so operators can transfer specimens end-for-end without disturbing fibre alignment. Pin densities range from 8 to 24 pins per centimetre depending on lot fineness.
Coarse flax tow needs open pin spacing to prevent choking, while fine wet-spun hackled sliver requires the tightest pin pitch to control fine elementary bundles.
| Parameter | Coarse Tow Bank | Medium Line Bank | Fine Cut Line Bank |
|---|---|---|---|
| Pin Density (pins per cm) | 8 to 10 | 12 to 16 | 20 to 24 |
| Pin Projection Height (mm) | 25.0 | 22.0 | 18.0 |
| Pin Wire Diameter (mm) | 0.75 | 0.55 | 0.35 |
| Bed Width Capacity (mm) | 50.0 | 35.0 | 35.0 |
| Maximum Length Capacity (mm) | 250.0 | 200.0 | 150.0 |
Pin alignment and surface condition determine whether results are reliable. Bent needles let short fibres slip past the grip while catching long fibres out of turn. Magnified inspection frequently shows hook tips, pitting, or rust spots that snag flax during the draw.
Sorter maintenance involves checking pin straightness under five-times magnification and washing the beds with anhydrous isopropyl alcohol to strip away accumulated plant wax, pectin, and comb dust from needle bases.
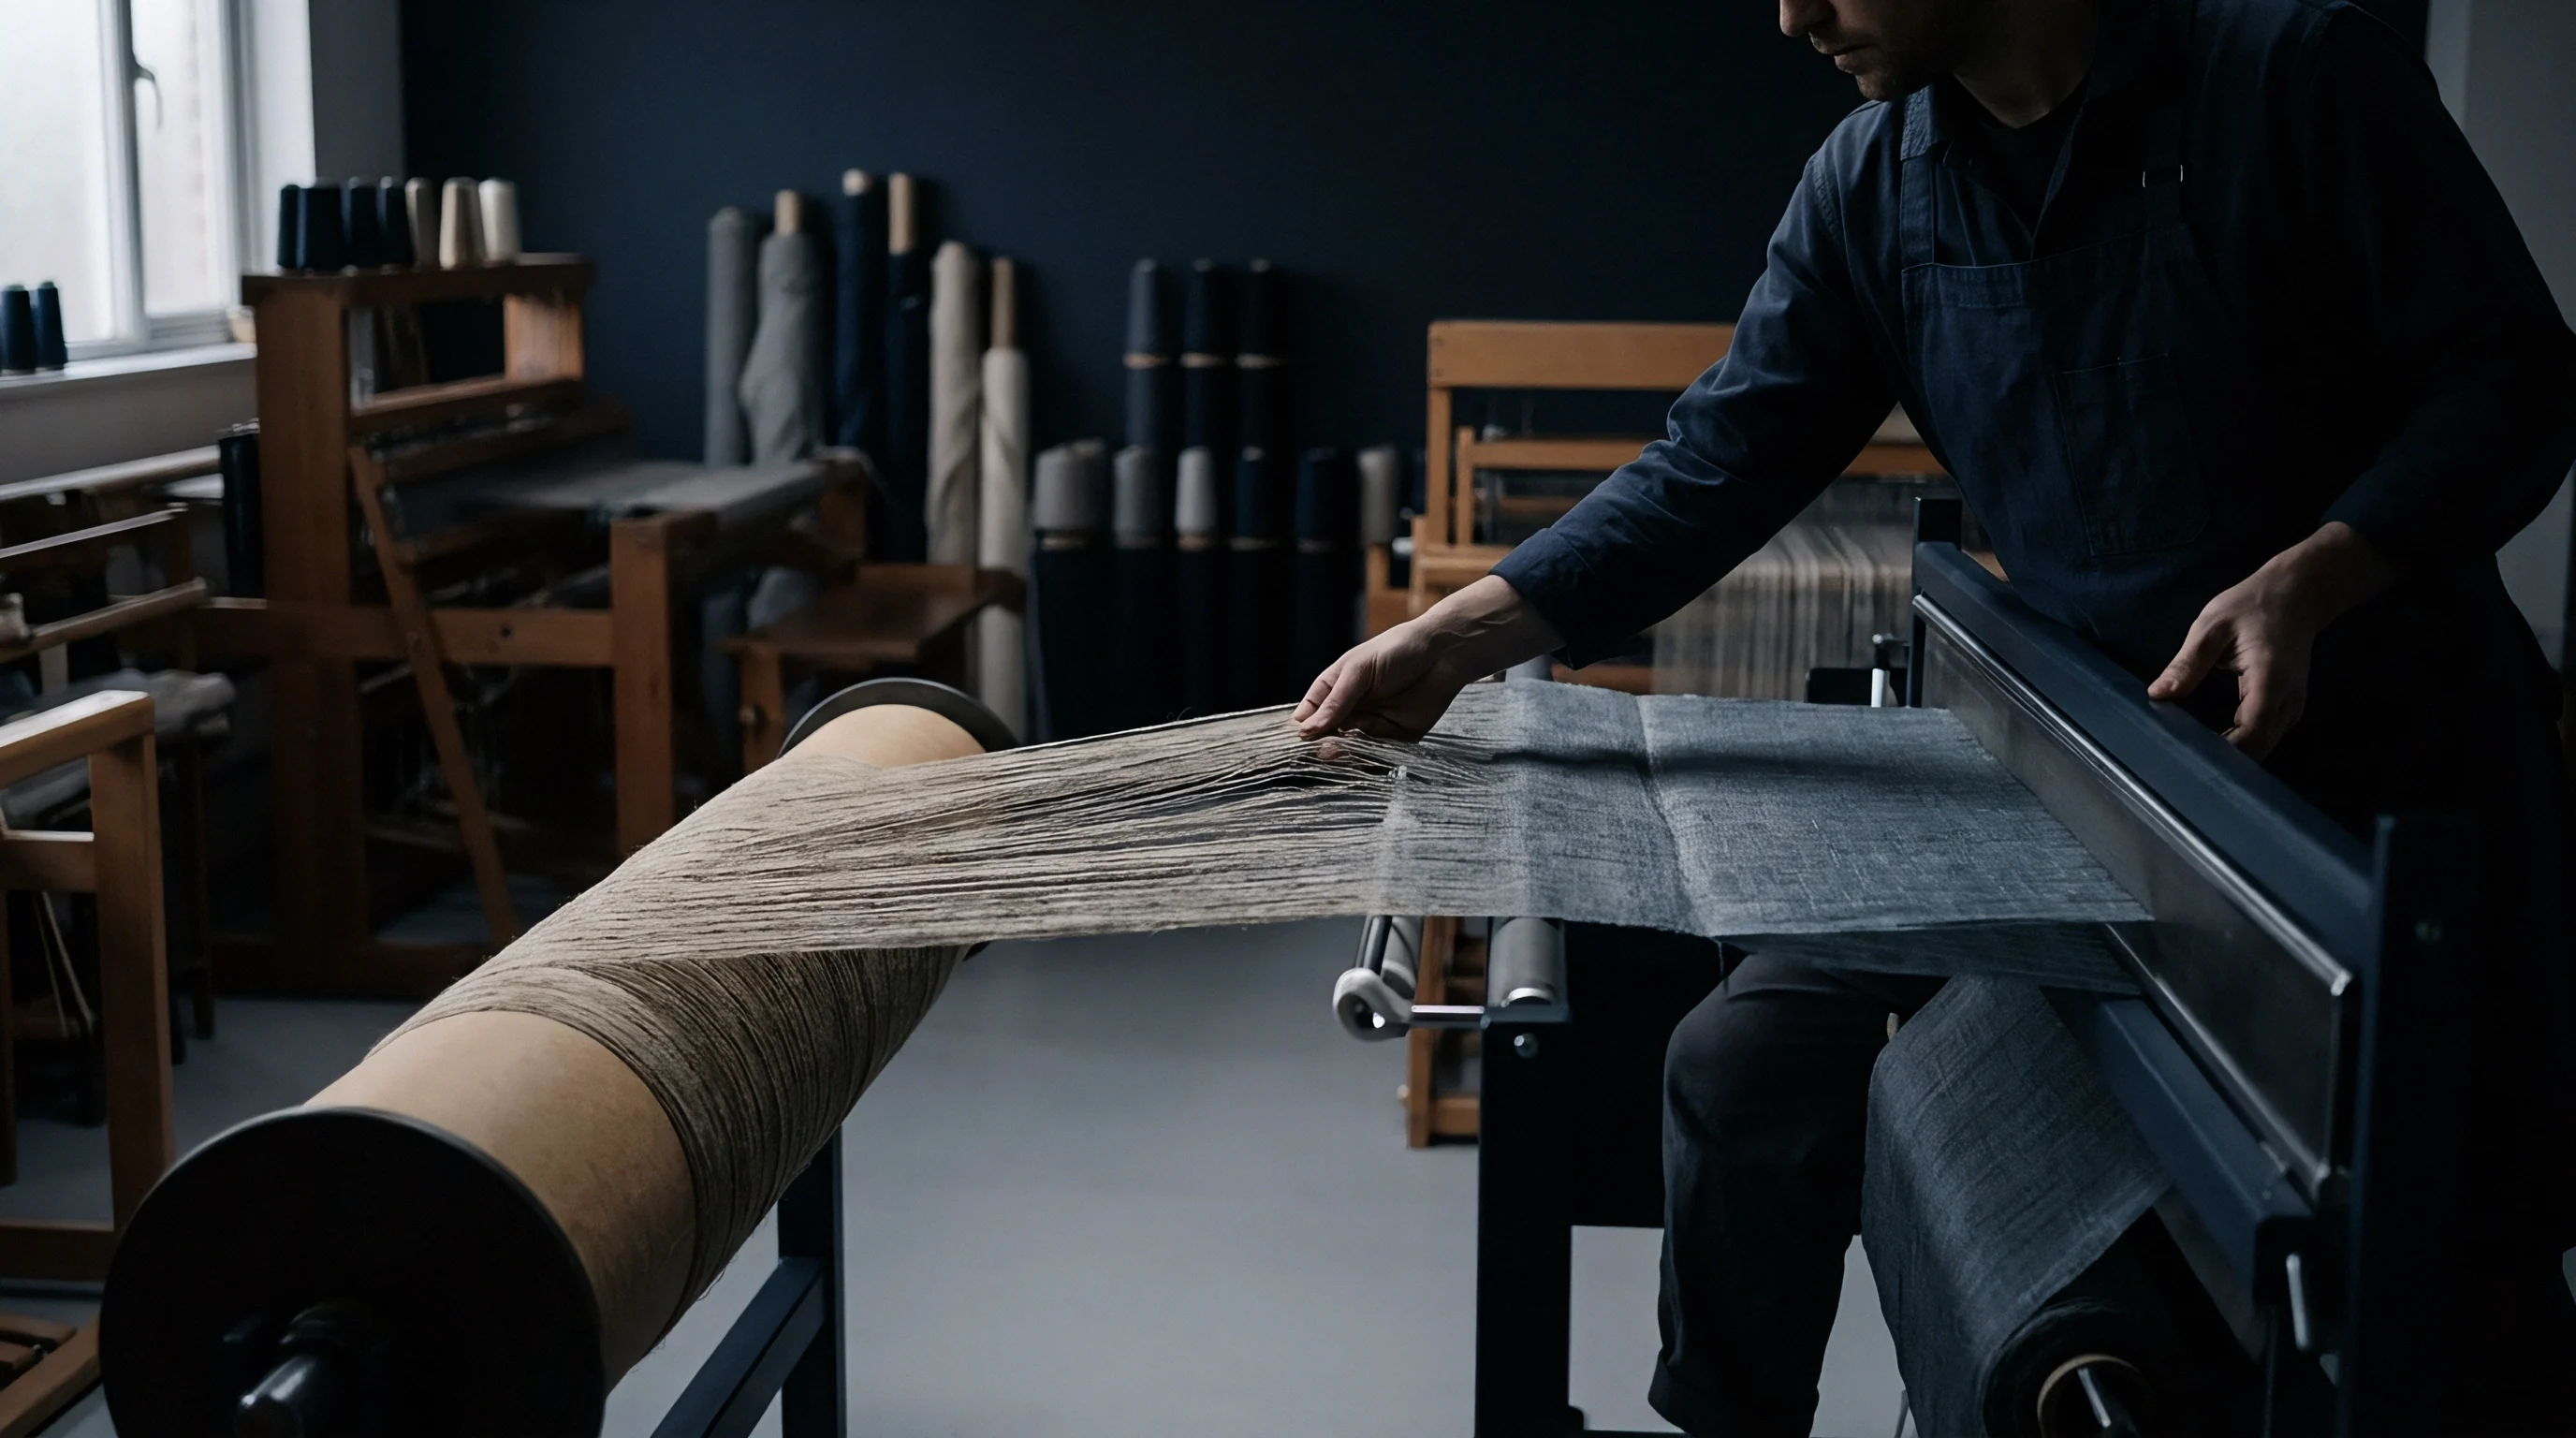
Sampling and Test Specimen Preparation
Representative testing depends on gathering incremental pinches across multiple bales or sliver cans throughout the delivery. Under ISO 6741, raw fibre is conditioned to moisture equilibrium at 20 plus or minus 2 degrees Celsius and 65 plus or minus 4 percent relative humidity for at least 24 hours. Feeding raw, uncombed sliver straight onto the needles without preliminary hand-dressing causes snarling and jams the combs immediately.
- Conditioning Equilibrium ensures fibre moisture content remains stable at 12 percent, preventing electrostatic charging and artificial bundle brittleness during sorting.
- Hand Square Dressing removes loose unaligned fibres from specimen ends using gentle manual pulls, establishing a straight reference baseline for initial comb insertion.
- Specimen Mass Standardization establishes test samples between 100 milligrams and 500 milligrams based on anticipated mean length, matching balance sensitivity.
- Comb Bed Alignment verifies that upper drop-combs fall squarely between lower fixed pins without binding or lateral deflection during sequential drops.
Fibre roots and tips should be aligned together whenever they can be identified. Technical flax fibres taper naturally toward the plant tip, with noticeable changes in linear density along the stem. Working the ends against a velvet sorting board forms an even square edge that serves as the baseline for every pull that follows.
A manual comb sorter with bent pins or greasy needle roots consistently overreports short fibre content by breaking long technical bundles during transfer.
Operators keep grip tension light during initial tuft placement to prevent crushing fine bast structures.


Array

Sequential Manual Sorting Procedure
Comb fractionation follows an exacting transfer and sorting cycle. The conditioned, dressed sample rests in the left comb bank with fibre ends projecting toward the front. Clamping the longest tips across their full width with a velvet-faced grip, the operator draws them out horizontally through the pins, taking care not to pull neighbouring resting fibres out of line.
These withdrawn groups move across to the right bank. The operator drops the gripped ends flush against the front row of needles and presses them home with a velvet presser. Repeating this sequence transfers the whole sample across, flipping the bundle so that all lead ends sit along a straight baseline.
With the left bank emptied, sorting begins.
Dropping the top combs on the right bank row by row exposes the fibres in 5-millimetre or 10-millimetre steps. The technician draws the longest remaining fibres first, laying them across a black velvet board in descending order of length. Each group is smoothed into a thin, compact ribbon perpendicular to the board’s baseline.
Sorting continues until even the shortest fragments caught in the needle roots are transferred.
- Excessive Pull Force snaps long composite technical bundles into multiple short fragments, artificially elevating short-fibre content numbers.
- Oblique Extraction Angles drag fibres across pin sides, creating friction tears and splitting coherent bundles into fine, unrepresentative fibrils.
- Irregular Group Widths cause uneven density on the array velvet, complicating visual profile checking and length category separation.
- Incomplete Root Extraction leaves the shortest fibres trapped at comb bases, causing undercounting of fractions under 10 millimetres.
Fraction Extraction and Mass Determination
Each sorted length band on the velvet board is gathered for weighing. Using fine brass forceps, the technician lifts each ribbon cleanly, checking that no fibres stay snagged in the velvet pile. The fraction transfers directly to an analytical microbalance sensitive to 0.01 milligrams.
Such precision is necessary because the longest fractions in fine-count flax lots often weigh less than 2 milligrams. Results are entered into the laboratory log beside their nominal length classes. Moisture changes during weighing skew these small masses quickly, which is why testing rooms control humidity strictly and balances use anti-static ionizers to stop stray fibres from leaping off the pan.
If an operator drags the clamp sideways during extraction, fine flax bundles shear against the pins, causing the entire length profile to collapse toward the short end and forcing the rejection of the test lot.


Arithmetic

Construction of the Cumulative Length Profile
Raw array weights must be transformed into cumulative frequency distributions to extract operational length parameters. Converting fraction masses to percentages makes the curve independent of starting sample mass. Plotting cumulative mass percentage against length class produces a standard Suter-Webb style cumulative diagram adapted for bast fibres.
- Calculate the total specimen mass by summing the measured mass values of all extracted length fractions.
- Divide individual fraction mass by total mass and multiply by one hundred to determine individual mass percentage per length class.
- Construct the cumulative mass percentage array by summing mass percentages sequentially from the longest length class down to the shortest.
- Plot group midpoint lengths along the vertical axis against cumulative mass percentage along the horizontal axis on square graph grid.
- Fit a continuous curve through the plotted points, smoothing minor manual sorting variations while preserving true distribution skewness.

Worked Example: 100 Nm Cut Line Flax Array Data
A 250.00-milligram sample of dressed cut line flax prepared for fine wet spinning provides an illustrative dataset. Comb fractionation produces sixteen groups taken at 5-millimetre steps from 75 millimetres down to 0 millimetres.
| Group Index | Length Interval (mm) | Midpoint Length (mm) | Fraction Mass (mg) | Mass Share (%) | Cumulative Mass (%) |
|---|---|---|---|---|---|
| 1 | 70.0 – 75.0 | 72.5 | 3.75 | 1.50 | 1.50 |
| 2 | 65.0 – 70.0 | 67.5 | 11.25 | 4.50 | 6.00 |
| 3 | 60.0 – 65.0 | 62.5 | 23.75 | 9.50 | 15.50 |
| 4 | 55.0 – 60.0 | 57.5 | 38.75 | 15.50 | 31.00 |
| 5 | 50.0 – 55.0 | 52.5 | 46.25 | 18.50 | 49.50 |
| 6 | 45.0 – 50.0 | 47.5 | 36.25 | 14.50 | 64.00 |
| 7 | 40.0 – 45.0 | 42.5 | 27.50 | 11.00 | 75.00 |
| 8 | 35.0 – 40.0 | 37.5 | 18.75 | 7.50 | 82.50 |
| 9 | 30.0 – 35.0 | 32.5 | 13.75 | 5.50 | 88.00 |
| 10 | 25.0 – 30.0 | 27.5 | 10.00 | 4.00 | 92.00 |
| 11 | 20.0 – 25.0 | 22.5 | 7.50 | 3.00 | 95.00 |
| 12 | 15.0 – 20.0 | 17.5 | 5.00 | 2.00 | 97.00 |
| 13 | 10.0 – 15.0 | 12.5 | 3.75 | 1.50 | 98.50 |
| 14 | 5.0 – 10.0 | 7.5 | 2.50 | 1.00 | 99.50 |
| 15 | 0.0 – 5.0 | 2.5 | 1.25 | 0.50 | 100.00 |
| Testing conducted per modified ASTM D1440 standard adapted for cut bast fibre metrics. Total sample mass equals 250.00 milligrams. Standard room atmospheric conditions: 20°C, 65% RH. | |||||
Key length metrics derive from points along this cumulative trace:
Upper Quartile Length (UQL) marks the fibre length at 25 percent of cumulative specimen mass. In this dataset, that quartile falls inside Group 4 (55.0 to 60.0 millimetres), interpolating to an Upper Quartile Length of 59.2 millimetres.
Mean Length (ML) is the mass-weighted average length of the sorted groups:
ML = sum(Midpoint Length Mass Share) / 100
Multiplying midpoint lengths by their mass shares gives a Mean Length of 49.1 millimetres.
Short Fibre Content (SFC) tracks material falling below an operational threshold. For fine ring-spun cut line flax, that boundary sits at 25.0 millimetres. Adding the mass percentages for groups 11 through 15 gives an SFC of 8.0 percent.
Length dispersion is expressed through the Coefficient of Variation (CV%):
Standard Deviation (SD) = sqrt( sum( (Midpoint – ML)^2 Mass Share ) / 100 )
Summing the squared deviations yields an SD of 13.8 millimetres, which, divided by the 49.1 millimetre Mean Length and multiplied by 100, produces a CV of 28.1 percent.
An Upper Quartile Length of 59.2 millimetres combined with a Short Fibre Content below 8.0 percent confirms spinnability up to 100 Nm count.
Seasonal retting variations can broaden the fibre length curve across single crop years, driving up the coefficient of variation even when harvesting and scutching remain tightly controlled.


Roving

Drafting Settings and Ratch Distance Allocation
Comb array metrics govern roller settings on drawing, roving, and spinning frames. On wet and dry spinning equipment, ratch distance ~ the gap from back nip rolls to front drafting rolls ~ must exceed the length of the longest functional staple. Pitching the ratch tighter than the Upper Quartile Length plus clearance causes roller pinching, breaking long bundles and generating thick-and-thin defects throughout the yarn.
| Flax Processing Route | Upper Quartile Length (mm) | Short Fibre Content (%) | Target Ratch Distance (mm) | Maximum Spinnable Count |
|---|---|---|---|---|
| Wet Spun Long Line | 180 to 220 | Under 3.5 | 210 to 245 | 100 Lea (60 Nm) |
| Wet Spun Cut Line | 55 to 65 | Under 8.0 | 68 to 78 | 80 Nm |
| Dry Spun Carded Tow | 35 to 45 | 12.0 to 18.0 | 50 to 60 | 26 Nm |
| Open End Blended Tow | 25 to 32 | Over 22.0 | Fixed Rotor Geometry | 18 Nm |
Opening the ratch to clear long fibres leaves short fibres unsupported in the draft field. Once Short Fibre Content climbs above 12 percent in fine wet-spinning slivers, uncontrolled fibres float between roll nips, clustering into draft waves that produce count variation, weaken tensile strength, and cause shedding on the loom.

Drafting Waves and End Breakage Dynamics
Spinning consistency on fine counts depends heavily on the ratio of Upper Quartile Length to Mean Length. A large spread indicates a skewed, tail-heavy length profile. In the roving draft zone, unguided short fibres surge ahead to front-roller speed while the long fibres are still anchored at the back nip.
This velocity difference creates thick slubs immediately followed by depleted thin spots that snap under drafting tension.
Controlling these draft waves requires aprons or faller gills to restrain floating fibres. Sorter array curves dictate the necessary pin-bar densities and faller speeds on drawing frames; higher short-fibre percentages require denser gill pinning to keep control over the sliver core.
Excessive short fibre content converts controlled drafting into chaotic bundle slip, triggering end breaks at the wet spinning frame nip.
Under standard delivery terms, spinning contracts permit mill rejection if delivered cut line sliver deviates from specification: Cut line flax sliver exhibiting an Upper Quartile Length below 52 millimetres or a Short Fibre Content exceeding 10.5 percent by mass shall be subject to full rejection or a 6 percent price penalty at buyer option.


Valuation

Commercial Specifications and Grade Classifications
Flax trading depends on verified staple distributions to establish lot values and grade differentials. Long hackled line flax commands top market pricing because its extended profile wet-spins into fine Lea counts. Raw tow, scutching waste, and carded waste trade at marked discounts based on their usable length and yield.
When deliveries fail to achieve expected yarn counts, comb sorting serves as the reference benchmark to settle value discrepancies.
Commercial pricing models reward high Upper Quartile Length and penalize elevated Short Fibre Content or wide CV figures. A 5-millimetre loss in UQL can force a spinner onto coarser yarn counts, lowering the realized value per kilogram of processed fibre. Buyers routinely write explicit comb thresholds into delivery terms to safeguard mill efficiency.
- Certified Comb Array Profile provides absolute mass distribution figures verified by an accredited independent textile testing laboratory.
- Moisture Adjusted Net Mass reconciles commercial weight based on standard regain allowances set by CINETEX or ISO 6741 guidelines.
- Hackling Yield Estimate correlates array short-fibre metrics with expected comb waste during primary mill preparation steps.
- Maximum Count Guarantee links physical length metrics directly to guaranteed spinnable Lea or metric count limits.

Arbitration and Contract Settlement Rules
If incoming bales produce excessive comb waste or heavy ends-down during mill trials, technical arbitration begins with joint array sampling. Representatives from both sides take reference samples under ISO 2370, sealing split portions for independent laboratory evaluation. Manual comb sorting remains the final authority, overriding high-speed optical measurements whenever financial claims are on the table.
Settlement terms compare measured UQL and Short Fibre Content directly against contract allowances. A UQL shortfall beyond minus 4 percent triggers automatic price deductions. Discrepancies past 8 percent give the buyer the right to reject the shipment entirely, returning the fibre at supplier expense with dead freight reimbursed.
Replacing subjective feel with bench measurements protects both counter-parties.
Penalties follow strict formulas based on comb array data. A contract for 60-millimetre cut line flax at 4.50 Euros per kilogram typically deducts 0.12 Euros per kilogram for every full millimetre that delivered UQL falls short of target. Excessive short fibre draws separate waste penalties to offset the extra combing and drafting losses incurred on the mill floor.