Optimizing Drawing Frame Draft Distribution Using Optical Flax Fibrogram Measurement
Optimizing draw frame break draft and ratch settings using optical flax fibrogram metrics reduces sliver weight CV percent below 2.9 percent.
Curve
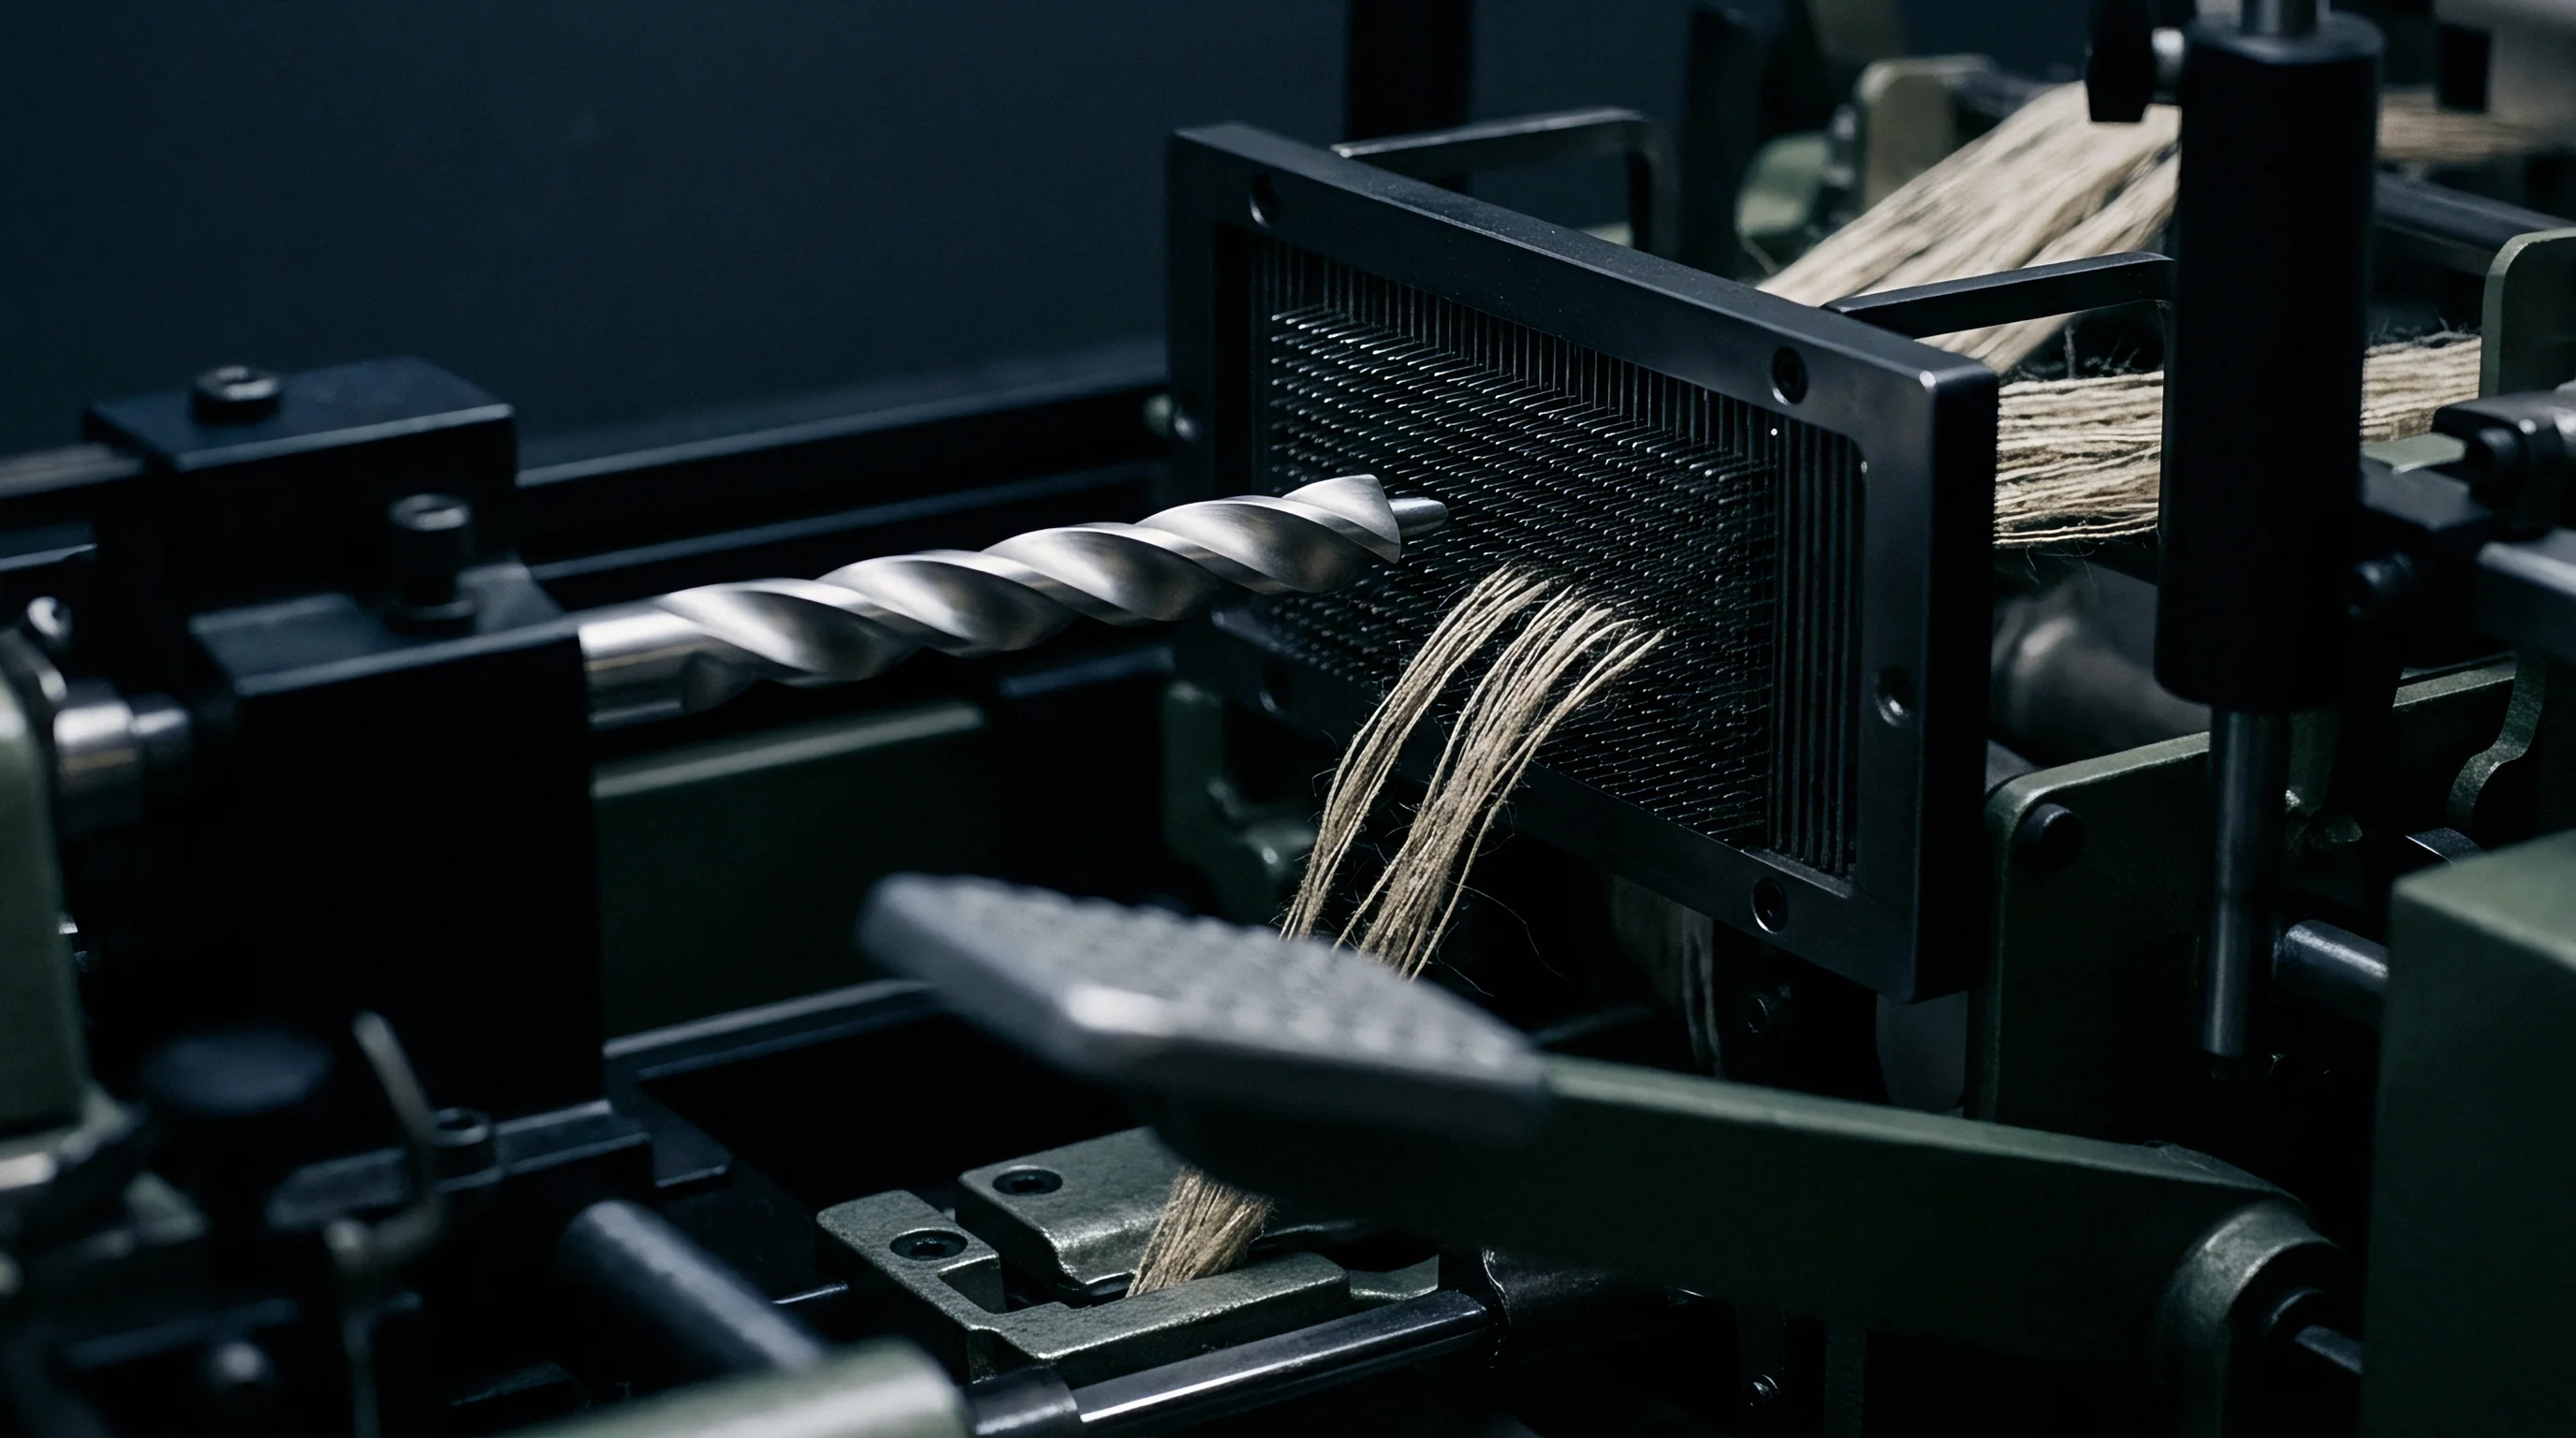
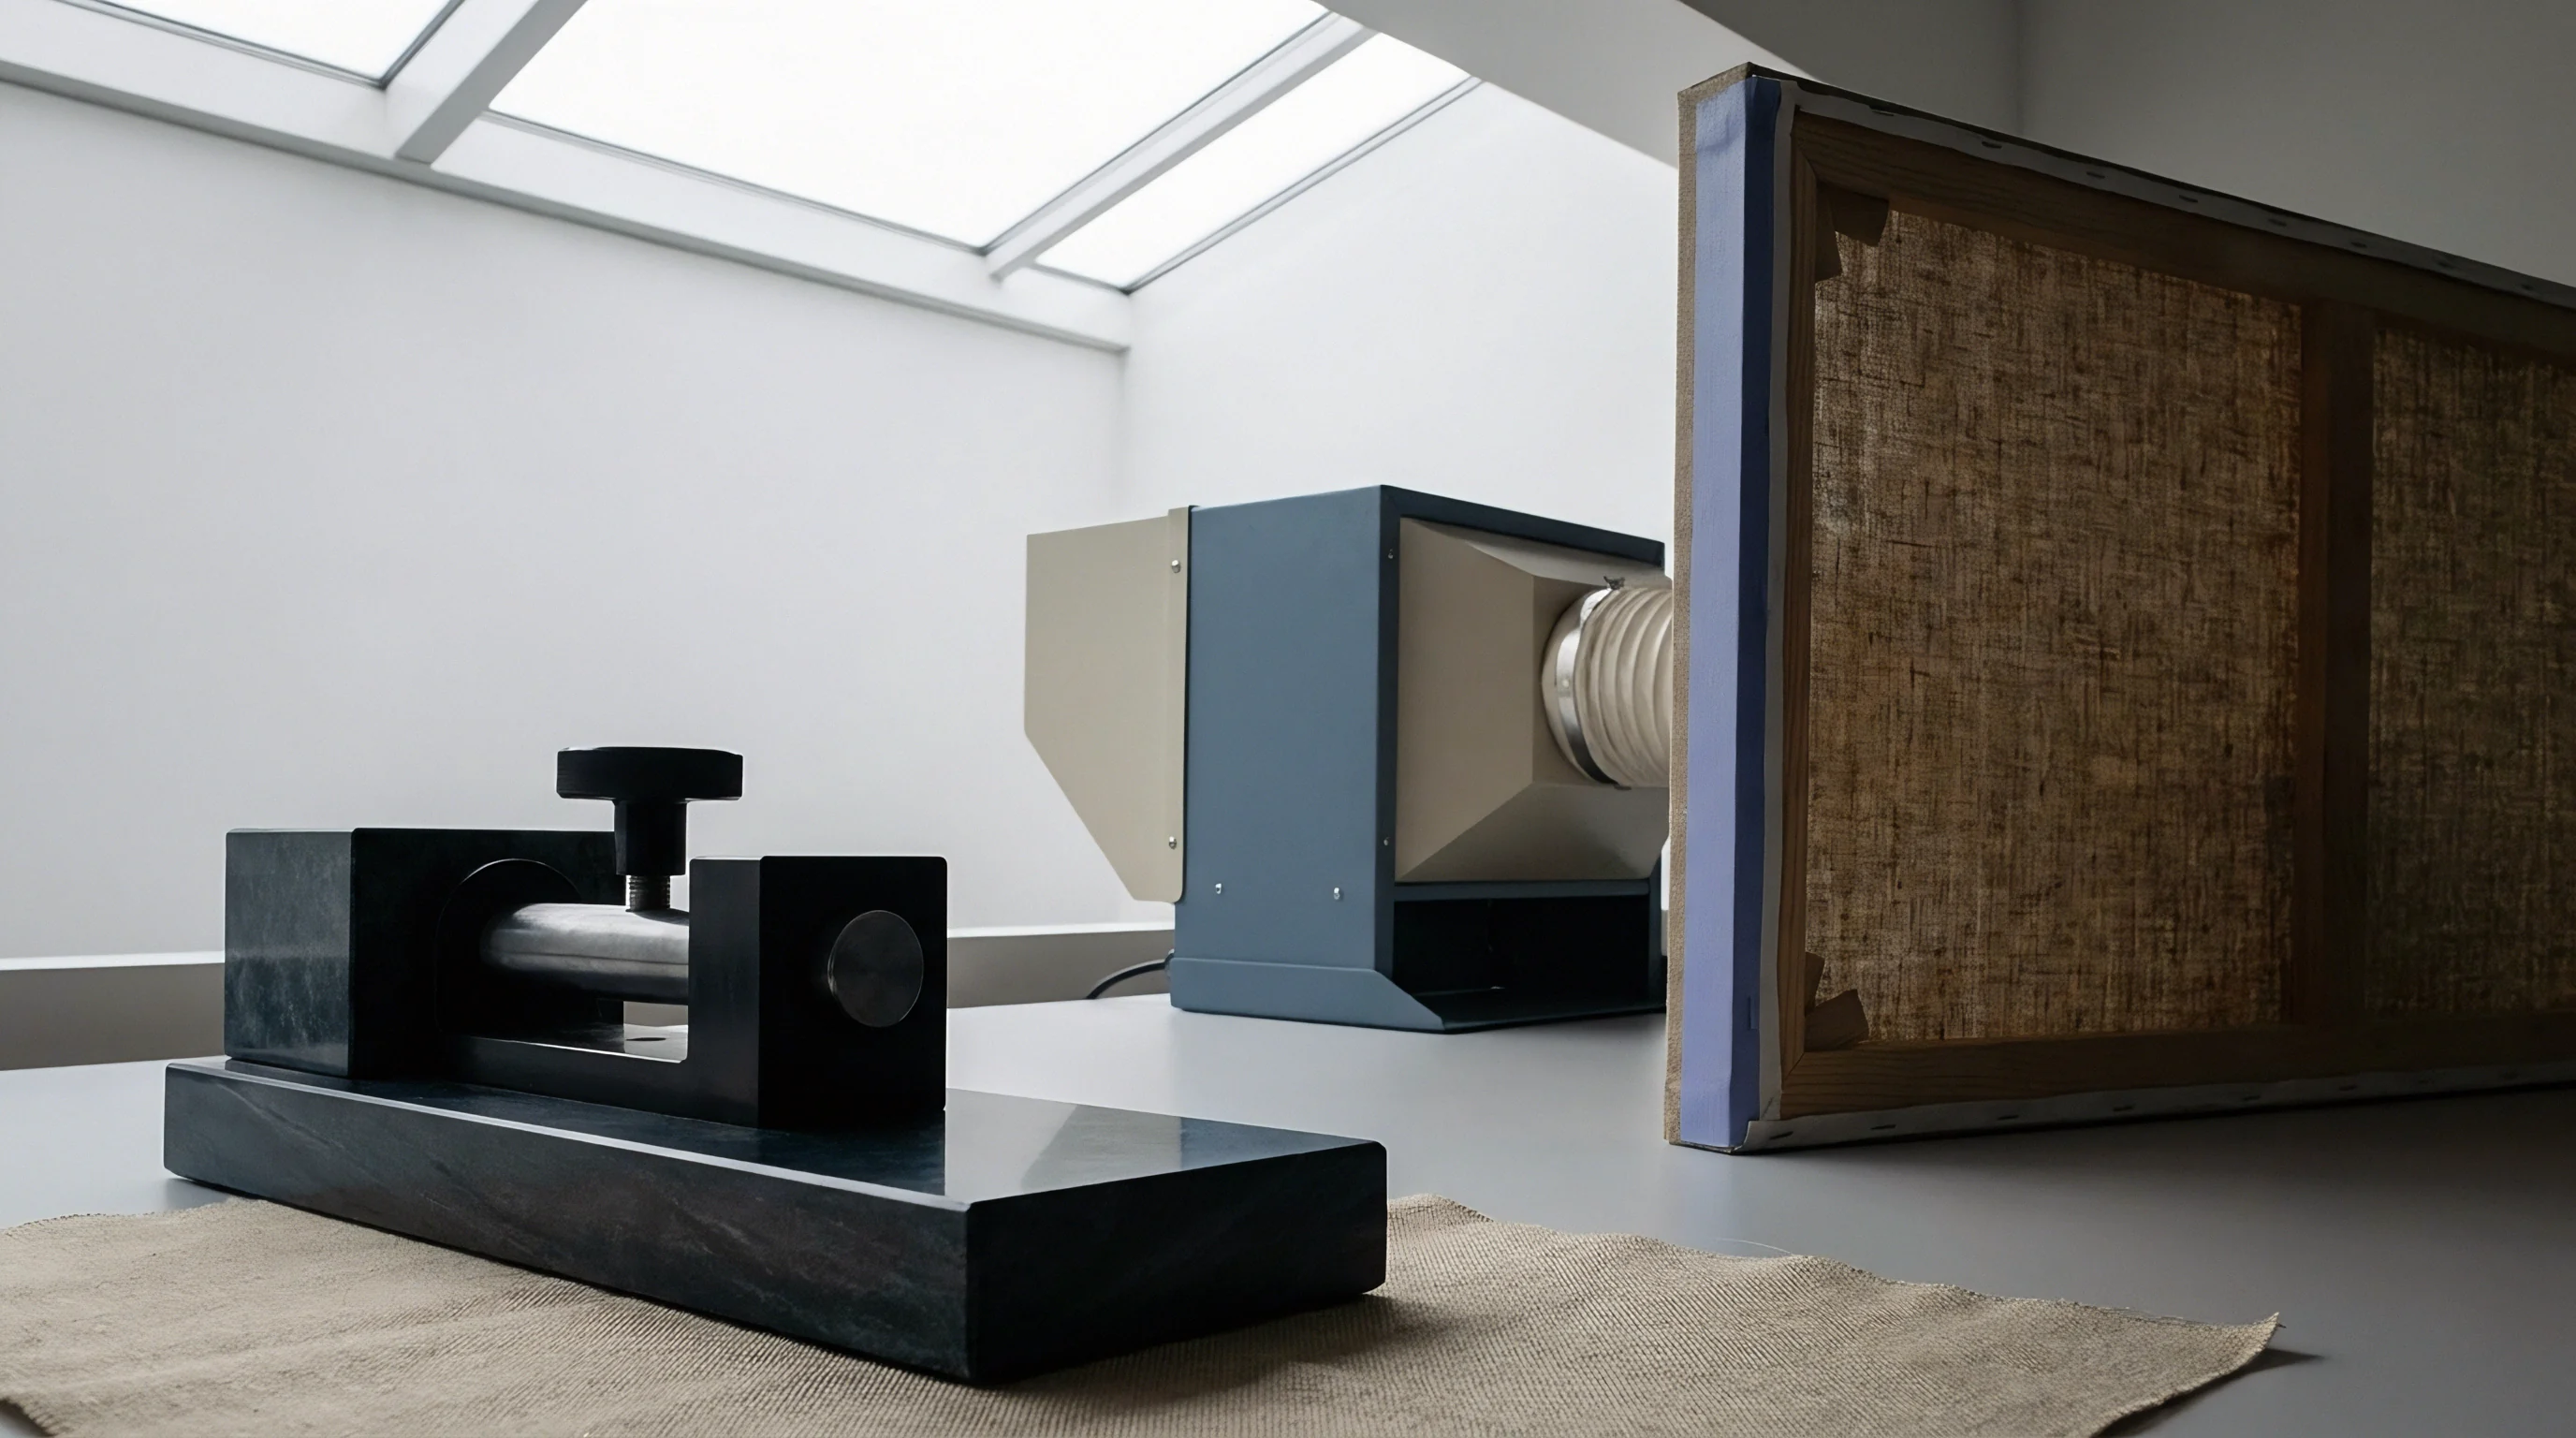
Optical measurement of flax fibre length using a fibrogram comb requires calibrating light absorption against bundle thickness across technical bast fibres. Standard cotton optical testing instruments register false attenuation curves when applied directly to scutched or hackled flax because technical bundles vary in diameter along their length and contain residual pectin complexes. Adapting optical fibrogram sensors for flax sliver involves preparing a aligned comb specimen using an automated needle sampler that catches fibres without selective breakage of long line fractions.
The resulting fibrogram plots the percentage of fibres reaching specific distances from the clamping line, generating continuous length distribution curves from which span length metrics emerge directly.
The 2.5 percent span length derived from the optical curve defines the initial physical boundary for drawing frame geometry. In hackled flax line sliver, this figure isolates the longest viable technical bundles that dictate the absolute minimum distance between roller nips. The 50 percent span length reflects the central mass of the staple population, while the ratio between 50 percent and 2.5 percent span lengths yields the optical uniformity index.
A low optical uniformity index in flax sliver signals a high proportion of short fractured bundles, which slip uncontrollably during drafting if back-zone tensioning fails to overcome inter-fibre cohesion.
The 2.5 percent optical span length of hackled line flax measured on a modified specimen holder ranges between 220 millimetres and 340 millimetres under 65 percent relative humidity.
Bast fibres differ from seed fibres due to the hierarchical structure of technical bundles. Mechanical stress inside the drawing zone splits bundle aggregates into smaller elementary units while simultaneously sliding fibres past one another. An optical fibrogram captures the actual effective length distribution of these technical bundles as they exist in the incoming sliver.
When the fibrogram reveals a steep decline between the 10 percent and 50 percent span lengths, the material contains significant staple disparity that generates draft waves unless pinned faller fields or optimized break draft distributions maintain continuous friction control during attenuation.
| Flax Preparation Grade | 2.5% Span Length (mm) | 50% Span Length (mm) | Optical Uniformity Index (%) | Short Fibre Fraction (<30mm %) |
|---|---|---|---|---|
| Hackled Line Sliver (First Pass) | 285.0 | 162.0 | 56.8 | 4.2 |
| Hackled Line Sliver (Third Pass) | 260.0 | 154.0 | 59.2 | 2.1 |
| Carded Tow Sliver (Combed) | 115.0 | 48.0 | 41.7 | 14.6 |
| Carded Tow Sliver (Uncombed) | 92.0 | 31.0 | 33.7 | 22.8 |
| Cottonised Flax (Enzyme Retted) | 38.0 | 19.5 | 51.3 | 8.5 |
Evaluating fibre length parameters through manual tuft sorting introduces operator bias and takes up to forty minutes per sample, whereas optical fibrogram scans yield reproducible length parameters within three minutes. Mill laboratories utilize optical scanning to audit incoming sliver lots before setting roller gauges on draw frames. Variations in dew-retting intensity alter the friction coefficient of technical bundles, shifting the optical curve shape without altering absolute bundle weight.
Precise fibrogram data allows spinning technologists to adjust drafting zones prior to run start, avoiding expensive trial-and-error frame adjustments.
Flax traders frequently state that manual hand-sorting parameters match optical fibrogram indices without mathematical conversion factors. That assertion ignores the physical reality of bundle aggregation, where visual length estimation routinely overstates the mean staple length by overestimating the contribution of isolated long tail bundles.
Nip
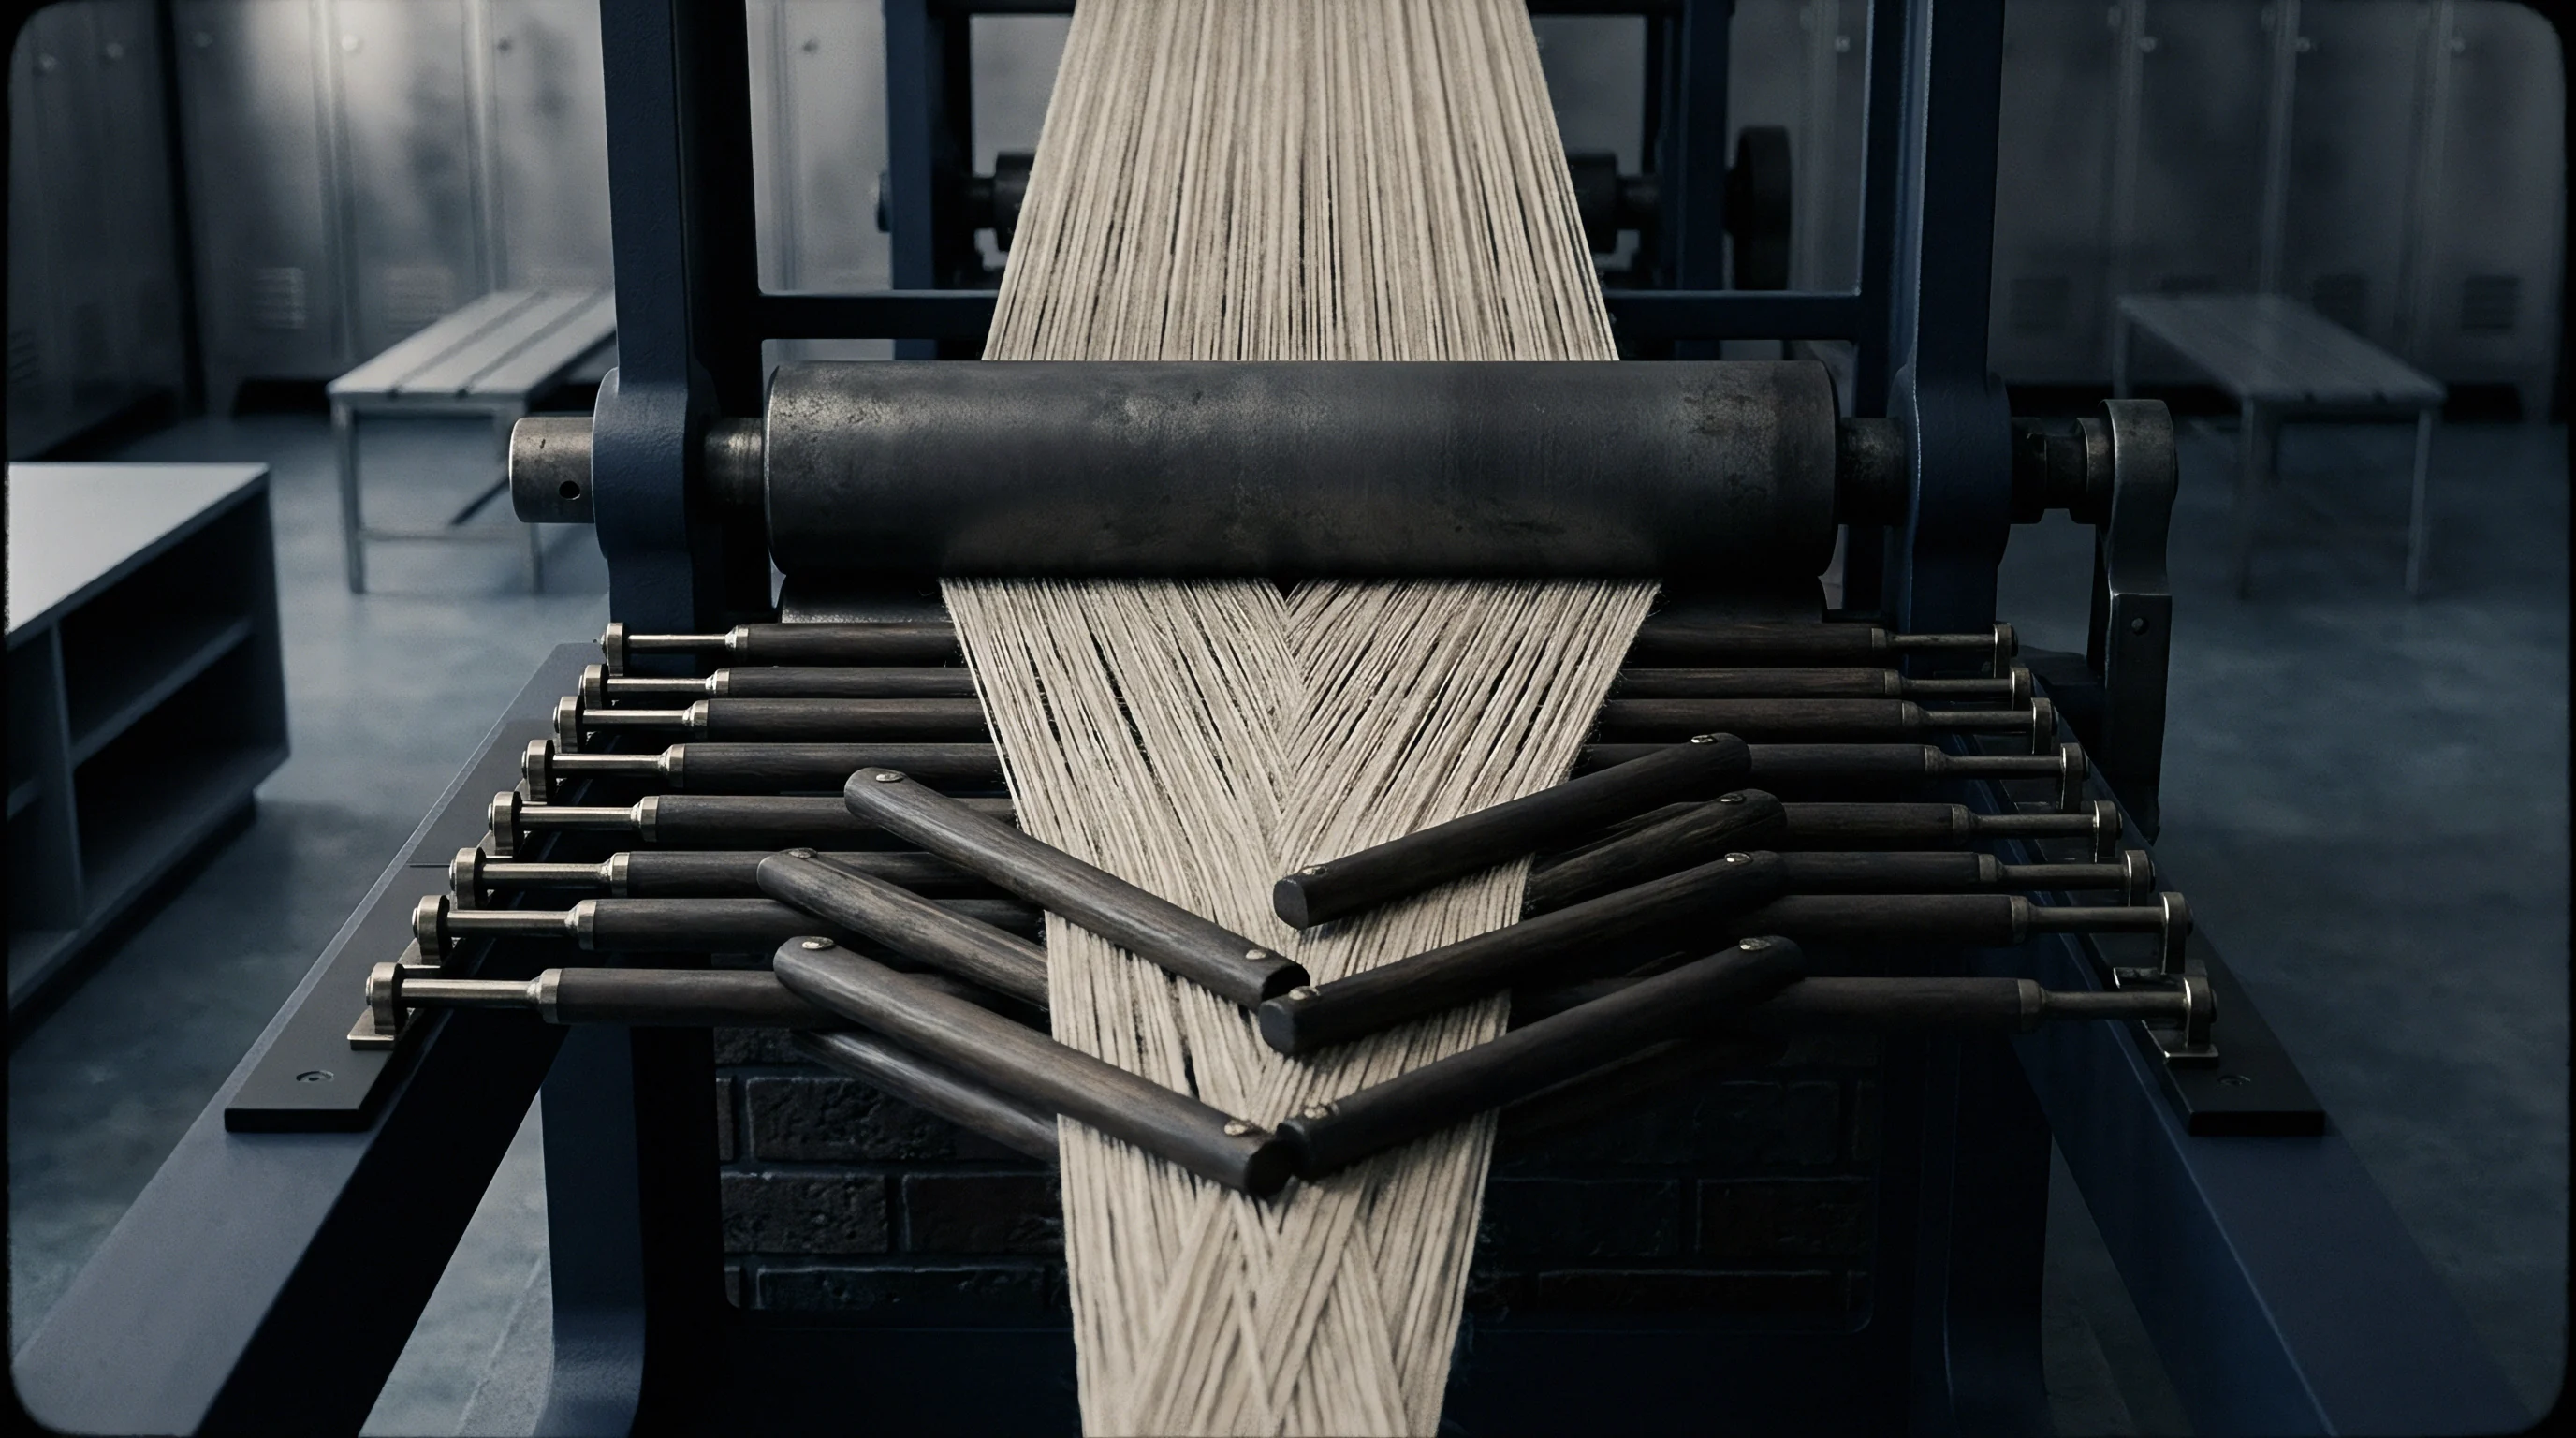
Roller nips on a bast-fibre drawing frame exert clamped pressure onto the moving sliver to control fibre velocity during draft application. The space between the back roller nip and the middle roller nip constitutes the break draft zone, while the space between the middle roller nip and the front roller nip forms the main draft zone. Setting the physical distance between these nips, known as the ratch, directly relies on the 2.5 percent span length obtained from the optical fibrogram.
Setting the ratch narrower than the maximum technical bundle length causes bundle rupture, severe end breakages, and damaged roller cots.
Excessive ratch width creates an unguided floating zone where short fibres move at uncontrolled speeds. Floating fibres accelerate prematurely toward the front roller nip under the drag of adjacent longer bundles, producing periodic thickness variations known as Martindale draft waves. In pinned drawing frames such as intersecting gill boxes, faller pins penetrate the sliver within the main draft zone to restrain short fibre acceleration.
The optical fibrogram provides the exact boundary metrics required to position the faller field relative to the front roller nip, ensuring maximum pin control over the 50 percent span length population.
Break draft prepares the sliver for main attenuation by breaking weak inter-bundle pectin bonds and straightening crimped technical fibres. Insufficient break draft forces the main draft zone to overcome both static friction and mass attenuation simultaneously, resulting in sliver gulper defects and irregular yarn count. Conversely, an aggressive break draft initiates premature drafting in the rear zone, causing uncontrolled bundle slip before the sliver reaches the pinned field or main drafting rollers.
- Cot hardness mismatch across top pressure rollers alters the effective nip point, shifting the actual drafting gauge away from the mechanical dial setting by up to three millimetres.
- Insufficient top roller load permits fibre bundle slip under heavy linear density loads, generating thick slub passages in the delivered drawing sliver.
- Pectin gum buildup on bottom fluted steel rollers changes the friction coefficient within the nip, inducing micro-periodic drafting waves in line flax sliver.
- Incorrect faller pin density relative to the optical staple distribution causes fibre lap formation around the bottom roller when processing high-short-fibre tow blends.
Optimizing nip pressure requires measuring total sliver mass entering the back roller zone alongside the optical uniformity index. Heavy slivers composed of thick technical bundles require elevated top-roller loading to prevent slipping during initial tensioning. Synthetic rubber cots with a Shore A hardness of 75 to 85 degrees provide the optimal grip for wet-spun line flax preparations, whereas softer cots degrade rapidly under the abrasive friction of dry flax bundle surfaces.
Failure to align roller nip geometry with optical fibrogram parameters increases sliver weight coefficient of variation, leading directly to high end-breakage rates at the spinning frame and reduced yarn tensile strength.

Arithmetic
Deriving the optimal break draft and total draft distribution requires explicit calculation using optical fibrogram parameters alongside incoming sliver linear density. The main draft multiplier balances the total draft target against the break draft setting. Total draft ratio across a three-pass drawing line typically ranges from four to twelve depending on whether the process targets fine wet-spun yarns or coarse dry-spun flax yarns.
Mechanical draft equations must incorporate fibre slip factors derived directly from the optical uniformity index.
How Does the Optical Uniformity Index Dictate the Break Draft Ratio?
The optical uniformity index dictates the proportion of mechanical draft allocated to the break draft zone. Slivers exhibiting a high uniformity index contain a narrow staple length distribution, allowing higher break draft settings without risking premature drafting of short fibres. The mathematical relationship establishes the break draft setting (Db) using the formula:
Db = 1.05 + left( fracUI100 × k right)
Here, UI represents the optical uniformity index derived from the fibrogram ratio of 50 percent to 2.5 percent span length, and k is a friction constant specific to the retting state and sliver linear density, typically ranging between 0.35 for dew-retted line flax and 0.50 for water-retted flax. For a hackled line sliver with an optical uniformity index of 58 percent and a friction constant of 0.40, the calculated break draft equals 1.282.
Calculating the main draft (Dm) proceeds by dividing total required draft (Dt) by the calculated break draft (Db). Assuming a total required draft of 8.0 for a second-pass draw frame, the main draft setting is calculated as 8.0 divided by 1.282, yielding a main draft of 6.240. The physical distance for the back-zone ratch (Rb) is set using the formula:
Rb = L2.5% + Mb
In this expression, L2.5% represents the 2.5 percent optical span length in millimetres and Mb is the back-zone safety margin, typically set to 12 millimetres for long-staple line flax. If L2.5% is 270 millimetres, the back-zone ratch setting equals 282 millimetres.
Standard mill specifications mandate a front-zone ratch safety margin between 3 and 8 millimetres above the 2.5 percent optical span length to prevent fibre crushing at the front nip.
- Obtain the 2.5 percent span length and 50 percent span length from the optical fibrogram laboratory report for the current sliver lot.
- Calculate the optical uniformity index by dividing the 50 percent span length by the 2.5 percent span length and multiplying the quotient by one hundred.
- Determine the break draft factor based on sliver linear density and fibre retting state using the established friction constant matrix.
- Adjust the main draft roller gear ratio on the drawing frame to match the calculated quotient of total draft divided by break draft.
- Set the mechanical ratch gauges on front and back drafting zones using the optical span length plus calculated zone safety margins.
| Drawing Passage | Incoming Sliver Density (ktex) | Total Draft (Dt) | Break Draft (Db) | Main Draft (Dm) | Front Ratch (mm) | Back Ratch (mm) |
|---|---|---|---|---|---|---|
| First Drawing Pass | 24.0 | 6.50 | 1.22 | 5.33 | 288.0 | 295.0 |
| Second Drawing Pass | 18.0 | 7.20 | 1.26 | 5.71 | 285.0 | 292.0 |
| Third Drawing Pass | 12.0 | 8.00 | 1.28 | 6.25 | 283.0 | 290.0 |
Consider a practical mill scenario processing a 40-tonne lot of dew-retted French flax line sliver entering a three-pass drawing system targeting a final roving count of 0.8 metric count (Nm). The initial sliver enters the first pass at 24 kilotex with an optical 2.5 percent span length of 280 millimetres and an optical uniformity index of 56 percent. Applying a total draft of 6.50 on the first pass with a break draft of 1.22 produces an intermediate sliver of 3.69 kilotex when doubling six ends.
The second pass applies a total draft of 7.20 with a break draft of 1.26 across six doublings, yielding a 3.08 kilotex sliver. The final passage applies a total draft of 8.00 with a break draft of 1.28 across four doublings, producing a draw frame sliver of 1.54 kilotex with a target sliver mass unevenness below 2.8 percent CV.
Matching mechanical draft distribution strictly to optical fibrogram metrics eliminates trial adjustments during lot transitions.
Evenness
Verifying drawing frame optimization relies on testing delivered sliver mass evenness using capacitive or optical mass sensors. Slivers processed through correctly parameterised draft zones show minimal short-term and medium-term mass variations. Capacitive evenness testing generates mass irregularity values expressed as percentage coefficient of variation (CV%) alongside spectrogram charts.
Spectrogram analysis identifies mechanical defects and draft waves by plotting mass variance amplitude against signal wavelength.
Draft waves appear on a sliver spectrogram as distinct wide hillocks rather than narrow sharp peaks. A draft wave hillock occurring at a wavelength corresponding to two to four times the staple length confirms improper ratch spacing or incorrect break draft distribution. Narrow sharp peaks indicate mechanical faults such as eccentric rollers, damaged gear teeth, or defective bearing assemblies.
Identifying the precise wavelength of a spectrogram hillock allows process engineers to trace drafting instability directly back to either front-zone floating fibres or back-zone bundle slipping.
Optical yarn and sliver sensors provide supplementary cross-sectional shape profiles that detect bundle splitting efficiency. As flax sliver advances through successive drawing passes, the average cross-sectional area of technical bundles decreases due to mechanical action. A well-optimized draft distribution reduces linear density while simultaneously shifting the optical fibre fineness distribution toward finer values without creating short fibre debris.
Standard ISO 16549 specifies capacitive measurement parameters for determining sliver mass unevenness and periodic defect wavelengths in spun textile slivers.
Comparing capacitive evenness figures between unoptimized drawing configurations and fibrogram-optimized configurations reveals substantial performance gaps. Unoptimized draw frames operating with default generic ratch settings generate sliver CV% values ranging from 4.5% to 6.2% on long-staple flax line. Applying optical fibrogram metrics to parameterise break draft and ratch gauges reduces sliver mass CV% to between 2.2% and 2.9% on the same raw material lot.
This improvement in sliver evenness transfers directly to roving quality and reduces spinning end-breakage rates by up to forty percent.
Does online optical sliver monitoring eliminate the need for off-line capacitive spectrogram audit sweeps during commercial production runs?
Costing
Fibre quality decisions made at the drawing frame dictate the final financial yield of spun linen yarn per linear metre of finished fabric. Suboptimal draft distribution increases sliver unevenness, forcing wet-spinning mills to lower spindle speeds to prevent excessive end breaks. Running wet-spinning frames at reduced speeds increases energy consumption per kilogram of yarn produced while inflating direct labor overheads.
Furthermore, high sliver mass CV% mandates spinning higher target yarn weights to ensure minimum tensile strength thresholds are met, consuming more raw flax fibre per woven metre.
Waste generation at the hackling and drawing stages directly impacts landed yarn cost. When incorrect ratch settings crush long technical bundles within the drafting zone, high-value line fibre breaks down into short tow-length fragments. These fragments migrate into suction waste collectors or generate nep defects that lead to yarn rejections during package winding.
Raw hackled flax line priced at 6.50 Euros per kilogram that is degraded into draw-frame waste yields a residual value of only 1.20 Euros per kilogram as tow byproduct, representing a direct material capital loss.
A worked financial analysis highlights the commercial leverage of draft optimization. Assume a spinning plant produces 50 tonnes per month of wet-spun Nm 30 line linen yarn destined for a 150 grams per square metre woven fabric. Achieving a sliver CV% reduction from 4.2% to 2.5% through optical fibrogram draft distribution allows increasing spinning spindle speeds from 5,800 RPM to 6,600 RPM.
This operational speed gain increases monthly plant output by 6.8 tonnes on the same capital footprint, reducing fixed overhead costs by 0.38 Euros per kilogram of yarn. Combined with a 1.5% reduction in yarn scrap rates during winding, total yarn manufacturing costs drop by 0.52 Euros per kilogram, translating to a saving of 0.078 Euros per linear metre of finished fabric at a 1.5-metre width.
Commercial sourcing contracts should explicitly incorporate sliver quality verification standard clauses to protect yarn buyers from hidden processing defects. A standard contract clause specifies:
Sliver supplied under this contract shall maintain a mass coefficient of variation (CV%) measured under ISO 16549 not exceeding 3.0% across all delivered cans, with optical 2.5% span length matching agreed lot fibrogram specifications within a tolerance of plus or minus 4.0 millimetres; failure to meet these metrics entitles the buyer to reject the lot or apply a 5% price deduction per percentage point of excess CV%.