Flax Cell Wall Microfibril Alignment Determination Methods
X-ray scattering and polarized Raman spectroscopy determine flax microfibril angles to project spinning performance and yarn tenacity.

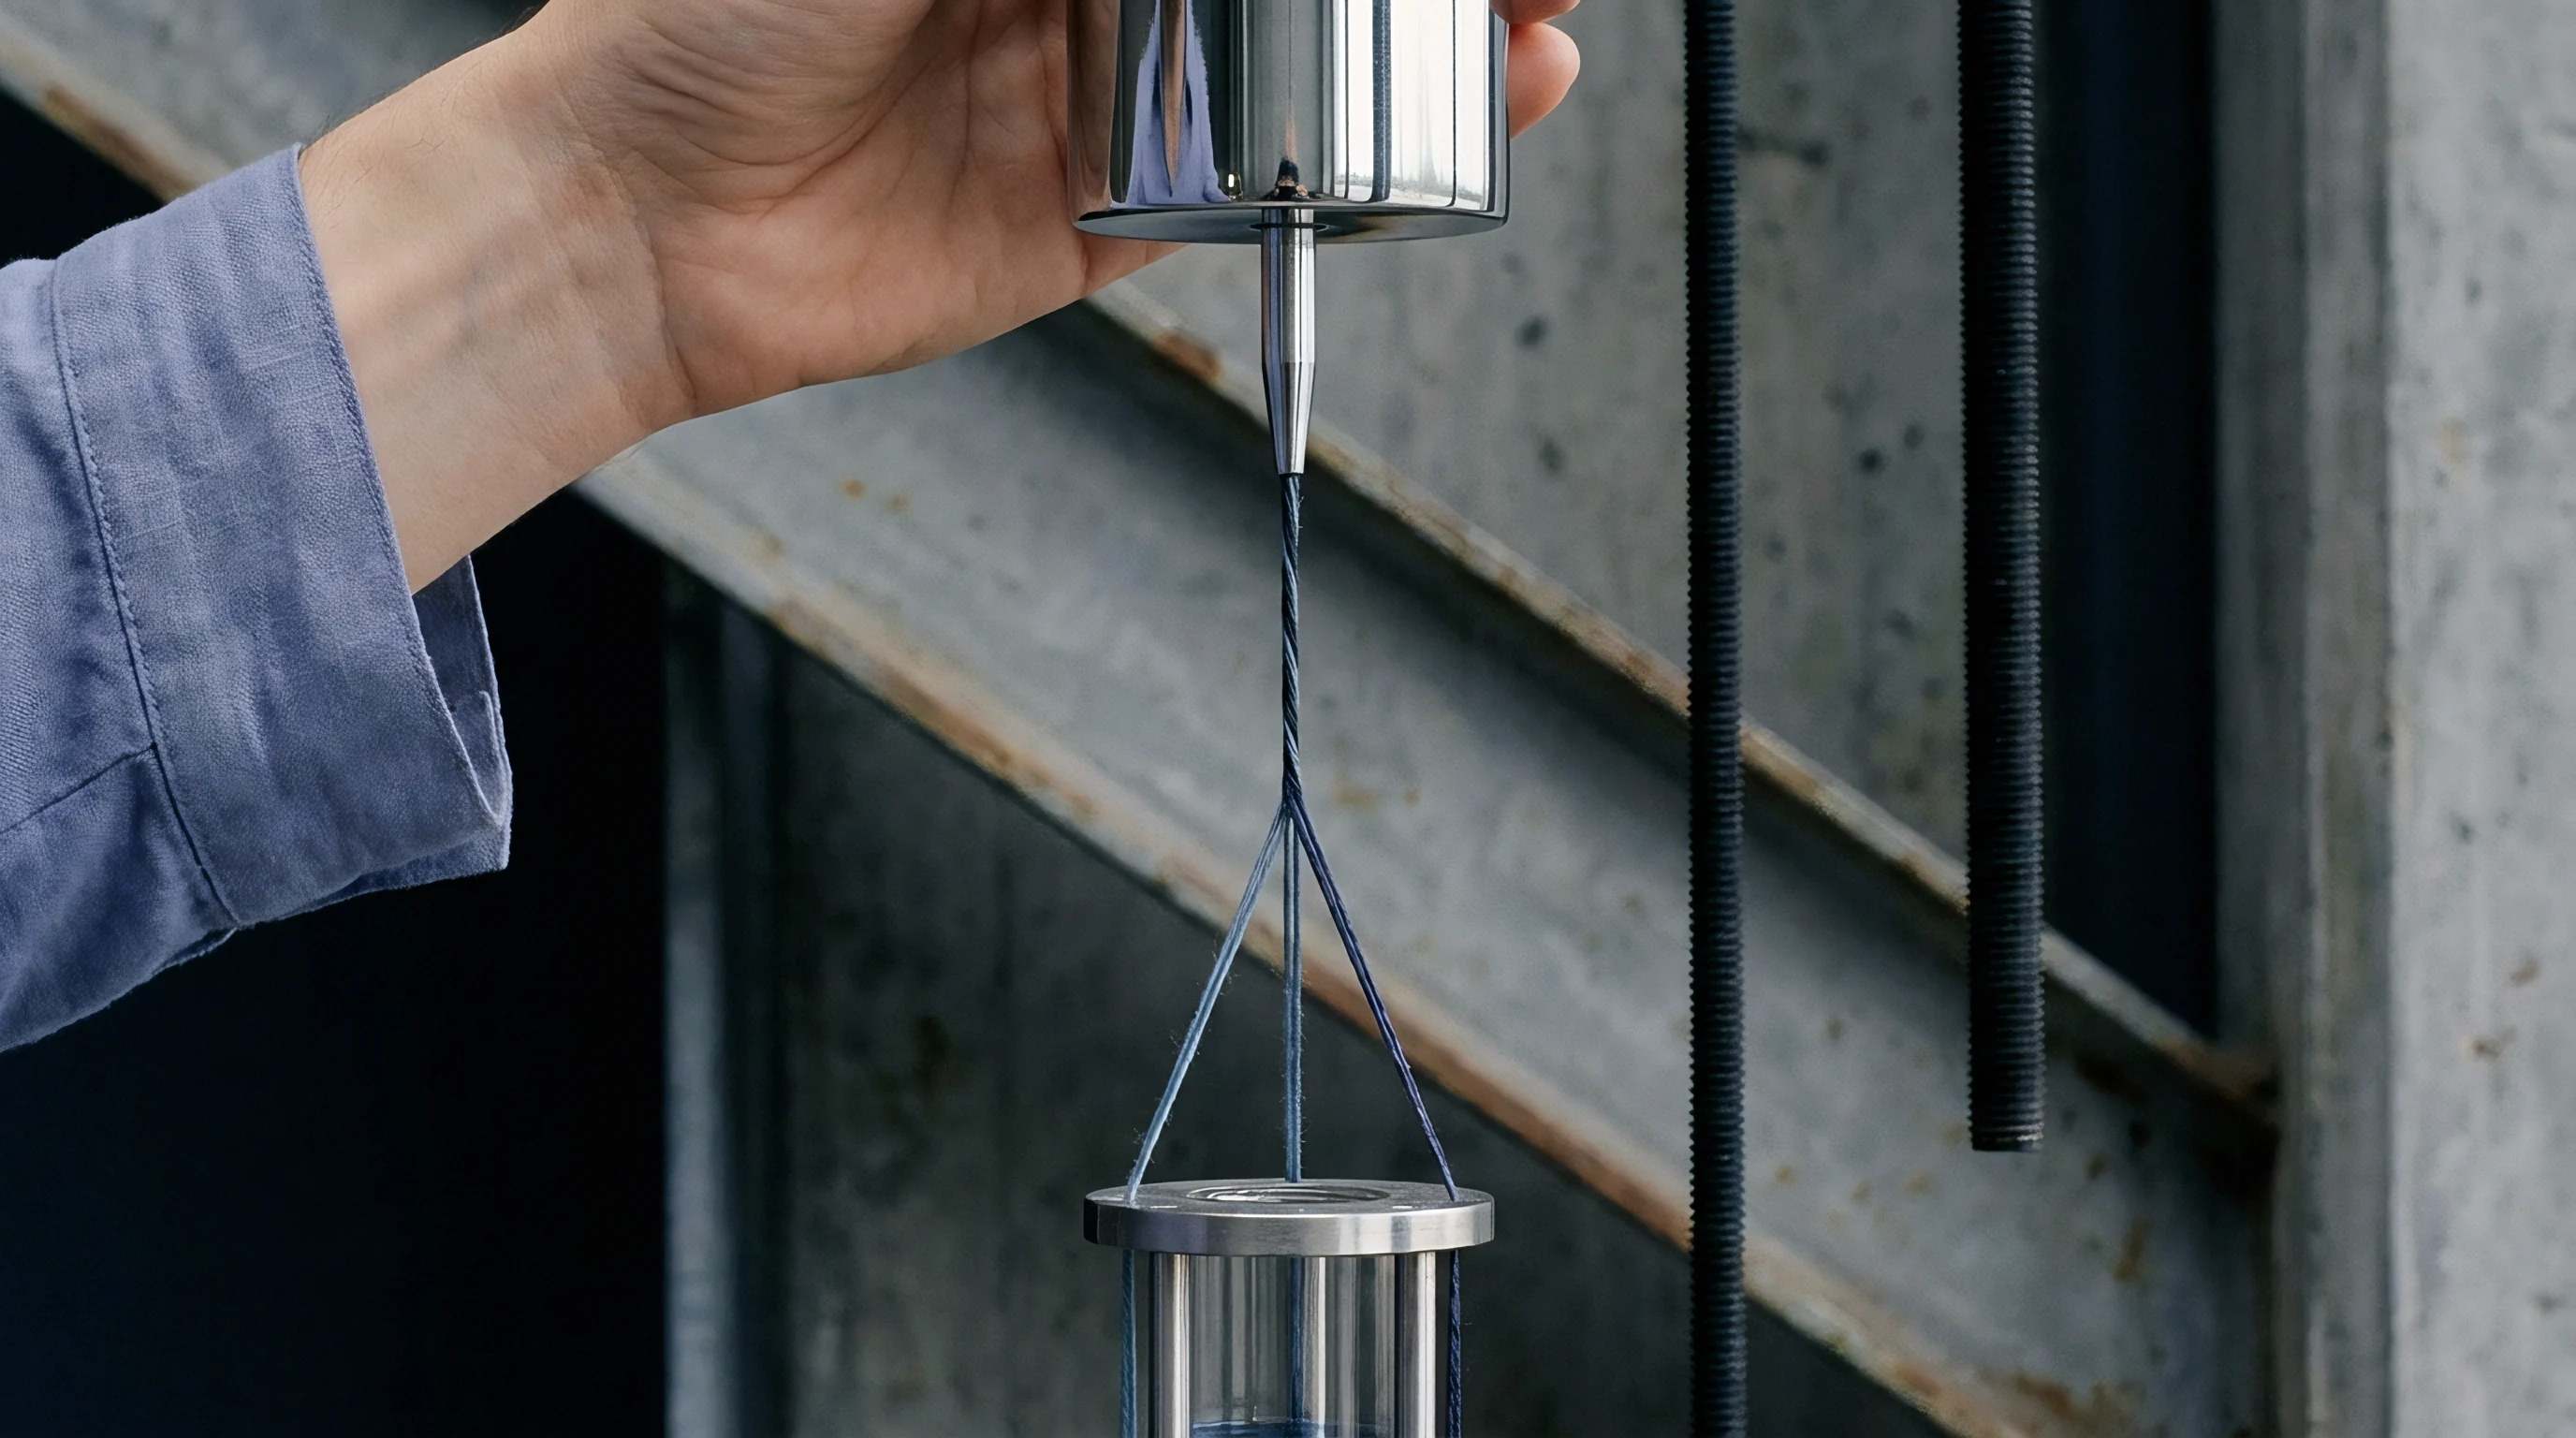
Spiral
Cell Wall Architecture and Microfibril Geometry
Elementary flax fibres derive their mechanical strength from cellulose microfibrils embedded within a hemicellulose and pectin matrix. The primary wall serves as an outer envelope, but the secondary wall dictates physical performance, making up over eighty percent of total wall volume. Within this secondary layer (the S2 layer), crystalline cellulose chains aggregate in parallel and wind around the lumen in a right-handed Z-twist helix.
The angle between these helical aggregates and the cell’s longitudinal axis is the microfibril angle. In high-grade long-staple line flax, this tilt angle holds tightly between six degrees and ten degrees, which delivers the highest axial tensile modulus.
The angle of these structural fibrils determines how mechanical stress disperses through the fibre under tension. When loaded axially, the crystalline fibrils bear tensile loads directly along their molecular backbones. Alignments approaching zero degrees maximize axial stiffness, resulting in specific tensile moduli between forty and eighty gigapascals.
When the microfibril angle widens toward fifteen degrees, the load path shifts: shear stresses build across the amorphous inter-fibrillar pectin matrix, decreasing axial modulus, raising elongation at break, and reducing ultimate tensile strength.
Coarse fibre lots exhibiting mean microfibril angles above eleven degrees lose up to thirty-five percent of their structural stiffness during drawing operations.
Accurate measurement of microfibril orientation requires separating the S2 layer’s contribution from that of the primary wall and the middle lamella. Middle lamellae bind elementary cells into technical bundles, introducing thickness irregularities and local distortions, while primary walls contain randomly oriented fibrils that scatter probe signals. Measurement protocols evaluate either single isolated elementary fibres or intact technical bundles, applying optical, spectroscopic, or diffraction techniques to resolve orientation distributions.
Microfibril angle variations across commercial crops arise from growth conditions and processing stages that disrupt cell wall uniformity:
- Growth lodging stress causing mechanical bending in the green stem, which forces the plant to lay down gelatinous G-layers with altered microfibril deposition angles during cell wall synthesis.
- Over-retting degradation where fungal or bacterial enzymes consume structural hemicelluloses, permitting individual microfibrils to slip out of their native helical alignment.
- Mechanical decortication damage introducing transverse kink bands and dislocation zones where microfibrils buckle and distort locally by fifteen to forty degrees away from the fibre axis.
- Stem height variation between basal, middle, and apical stem sections, yielding wider microfibril angle distributions in the coarse basal fibres compared to the fine middle stem fraction.
Dislocations create localized stress concentrations along the fibre. Under tensile loading, these points develop micro-cracks that spread along microfibril boundaries. Measuring alignment across raw flax lots indicates fibre tenacity, stiffness, and spinning performance before material ever reaches the hackling line.
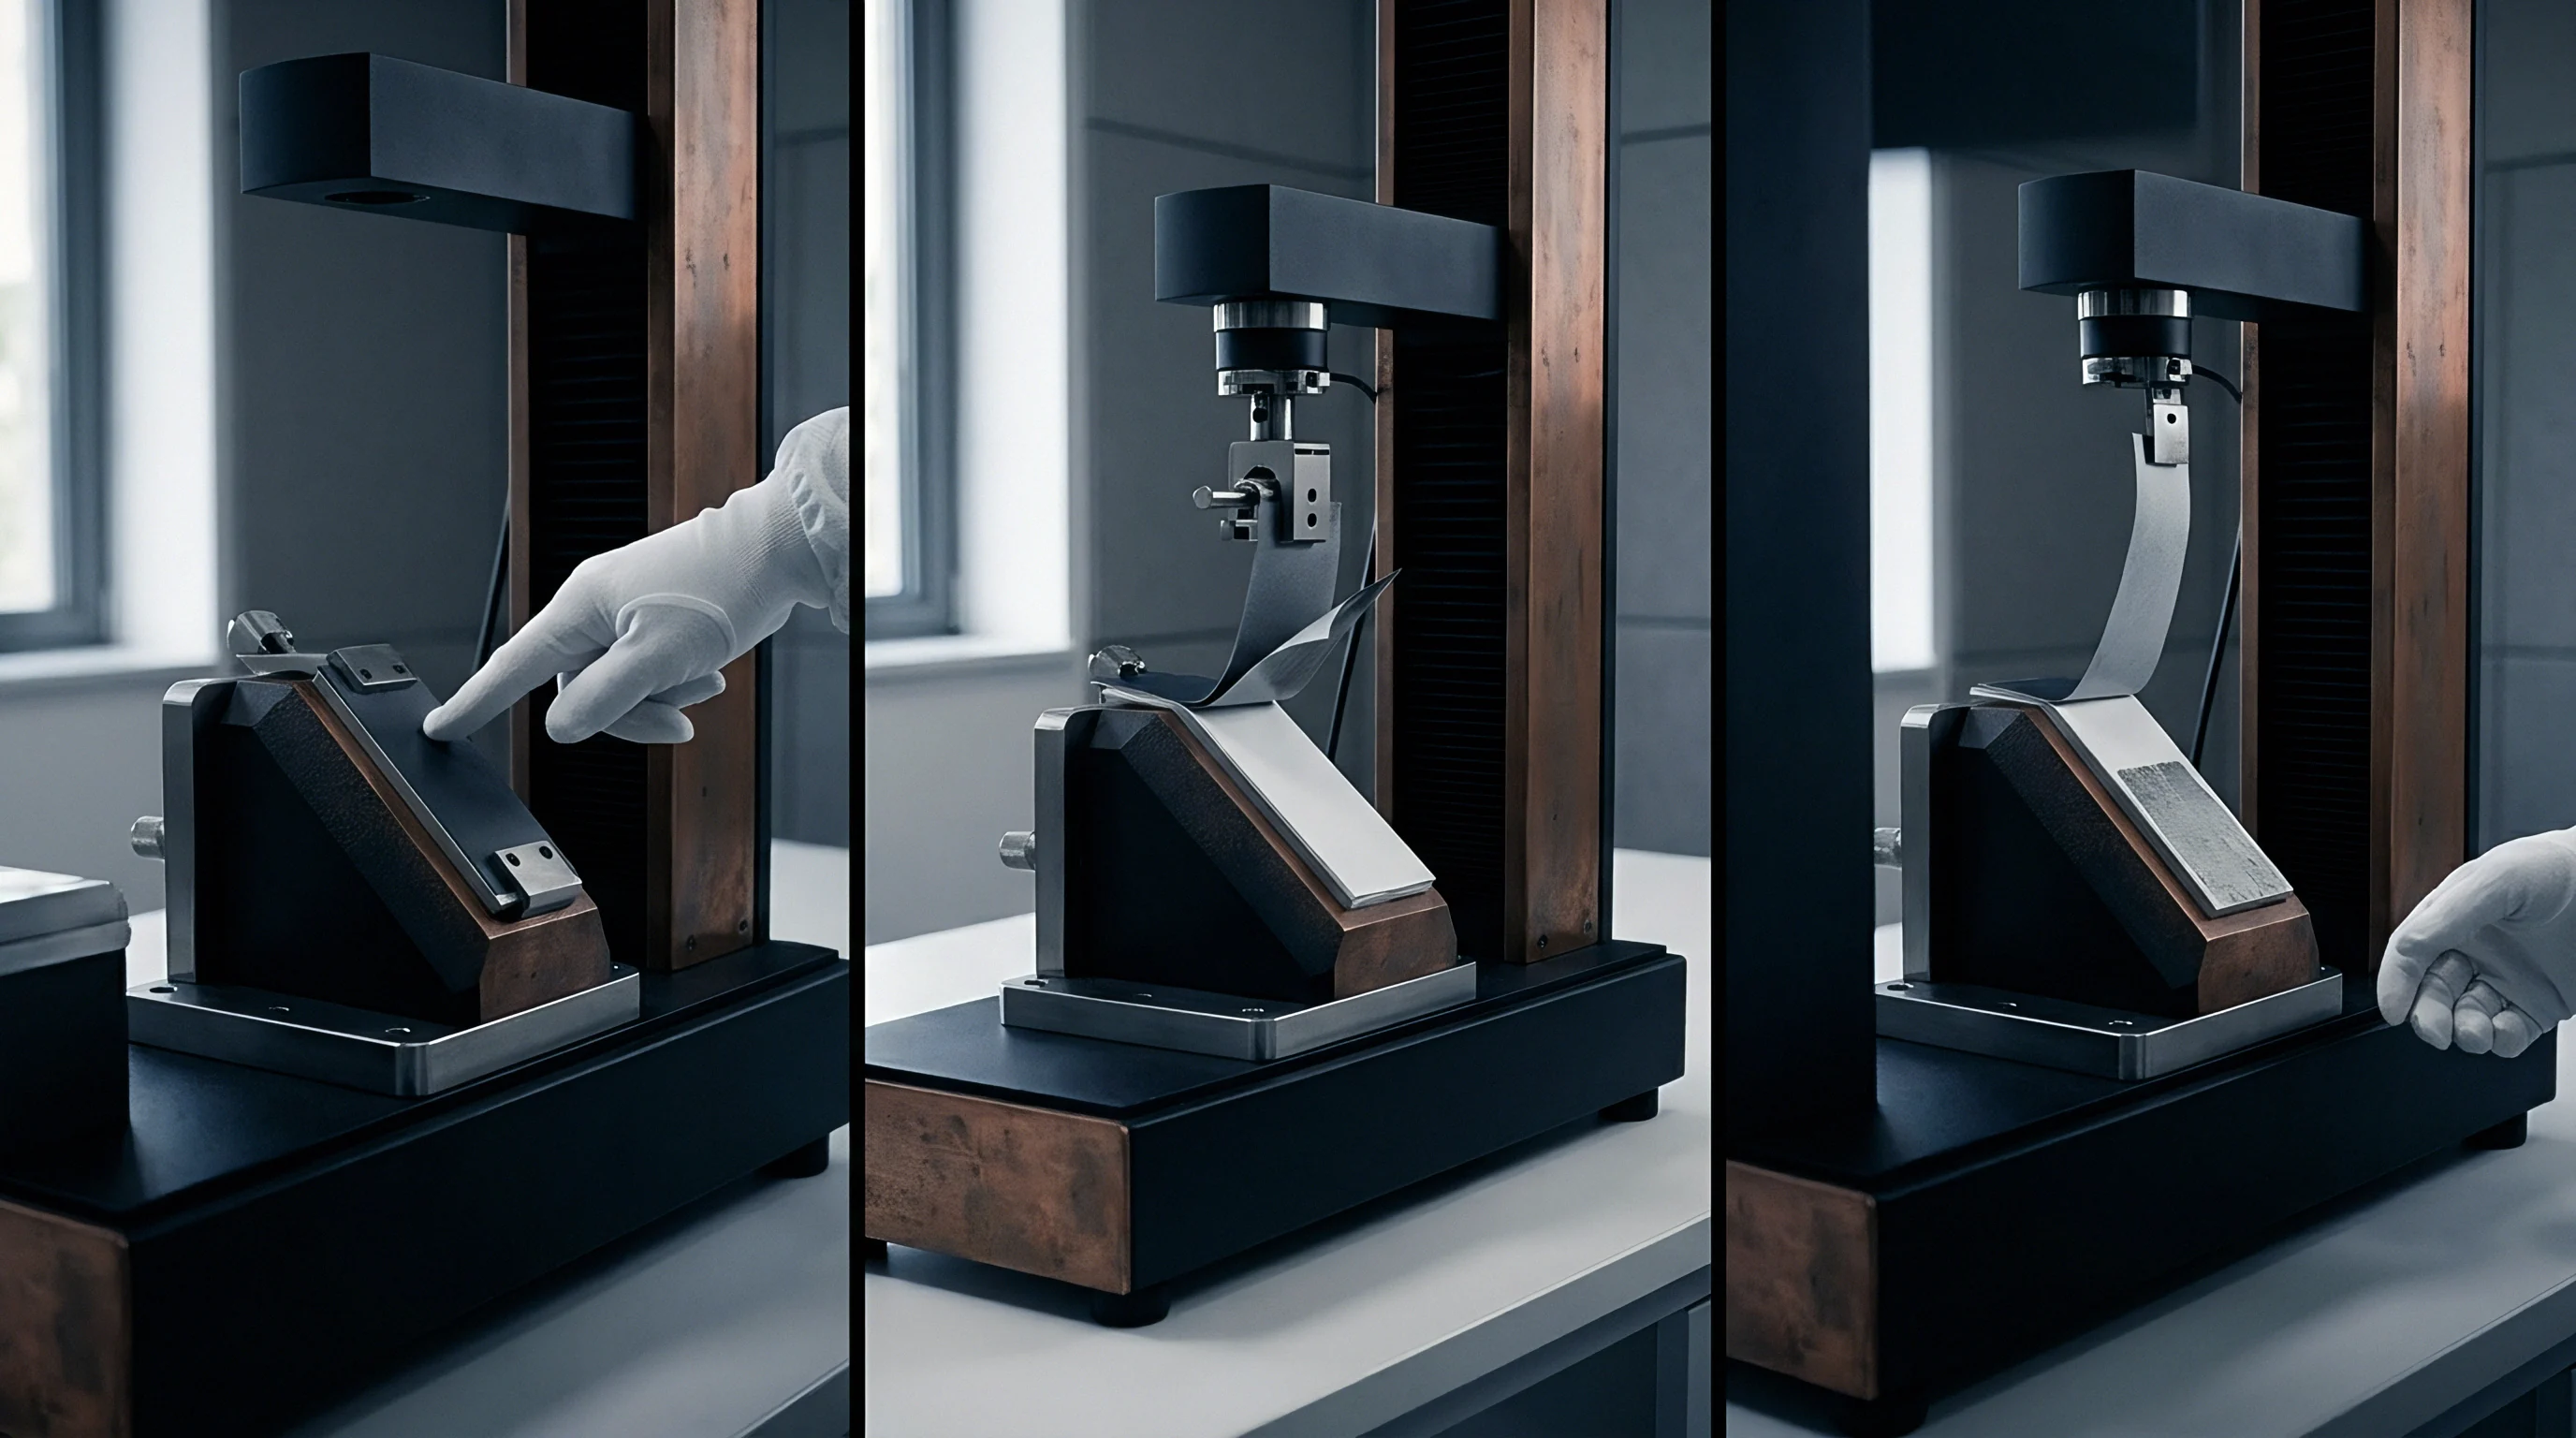
Beam
Polarized Light Microscopy and Birefringence Mapping
Optical measurement depends on the anisotropic refractive index of crystalline cellulose I, which displays strong positive birefringence: the refractive index parallel to the microfibril axis is higher than in the perpendicular direction. Polarized light passing through an elementary fibre splits into orthogonal waves of different velocities, generating an optical retardation governed by S2 layer thickness and microfibril tilt.
Quantitative polarized light microscopy uses Senarmont or tilting Berek compensators to cancel this sample retardation. Orienting an elementary fibre at forty-five degrees to crossed polarizers allows exact determination of the extinction angle, which occurs when the optical axes of the microfibrils align with the polarizers. Because spot sizing constrains spatial resolution, modern systems use digital imaging software to calculate mean retardation across thousands of pixel coordinates per cell, producing detailed spatial maps of microfibril alignment.
Polarized Raman Spectroscopy for Molecular Alignment
Polarized Raman spectroscopy measures molecular orientation directly from the polarization state of laser light scattered by bonds in the cellulose backbone. Laser light focused through a high-numerical-aperture objective targets the S2 layer, exciting vibrational modes in the polymer chains. The intensity of the symmetric C-O-C ring stretch band at 1095 reciprocal centimetres varies with the angle between the laser polarization vector and the microfibril direction.
Rotating the sample relative to the excitation beam’s linear polarization yields an intensity profile that peaks when the polarization aligns with the microfibril axis. Comparing the 1095 reciprocal centimetre peak to orientation-insensitive reference bands, such as the CH2 bending vibration at 1460 reciprocal centimetres, gives dichroic ratios. These ratios are converted via second- and fourth-order Legendre polynomials into orientation distribution functions for the analyzed volume.
| Determination Method | Probe Beam Spot Size | Sample Preparation Complexity | Angular Accuracy | Measurement Speed per Fibre |
|---|---|---|---|---|
| Polarized Light Microscopy | 1.0 to 5.0 micrometres | Low: single fibre mounting | Plus or minus 1.5 degrees | 3 to 5 minutes |
| Polarized Raman Spectroscopy | 0.5 to 1.0 micrometres | Moderate: cross-sectioning optional | Plus or minus 0.8 degrees | 12 to 20 minutes |
| Second Harmonic Generation | 0.3 to 0.6 micrometres | Low: intact fibre immersion | Plus or minus 0.5 degrees | 2 to 4 minutes |
| Polarized FTIR Microscopy | 10.0 to 20.0 micrometres | High: thin sectioning or flattening | Plus or minus 2.0 degrees | 1 to 2 minutes |
Second Harmonic Generation microscopy applies non-linear optics to image microfibrils in native fibres without dyes or sectioning. Non-centrosymmetric crystalline cellulose I produces strong second-harmonic signals under pulsed femtosecond infrared illumination. Adjusting the input polarization maps microfibril angles across the 3D cell wall at sub-micron resolution, distinguishing surface dislocations from the internal helical structure so local defects do not distort the broader lot average.
Polarized Raman micro-spectroscopy using a 532 nanometer excitation source achieves microfibril angle resolution within plus or minus 0.8 degrees across single S2 cell wall layers.
Uncorrected elliptical cross-sections introduce optical path length errors during compensation measurements. Underestimating or overestimating cell thickness can shift the calculated angle by up to four degrees, risking the wrongful rejection of high-modulus line flax lots that meet mechanical criteria.

Scattering
Wide-Angle X-Ray Scattering Fundamentals
Wide-Angle X-ray Scattering provides an absolute, volume-averaged measurement of microfibril orientation independent of optical refraction models. A monochromatic beam, typically Copper K-alpha radiation at a wavelength of 0.1542 nanometres, passes through a bundle of parallel flax fibres, where crystal lattice planes in cellulose I diffract the beam according to Bragg’s law.
Equatorial reflections contain the orientation data. Analysis focuses on the 200 crystallographic plane at a two-theta angle near 22.6 degrees. In an idealized bundle with microfibrils parallel to the fibre axis, the diffracted rays form sharp spots on the detector; as microfibrils tilt into a helix, those spots elongate along the azimuthal ring into distinct arcs.
Azimuthal Intensity Distribution and Hermans Factor
Determining quantitative angles requires scanning the azimuthal intensity distribution around the 200 reflection ring. Plotting intensity against azimuthal angle produces symmetrical peaks centered at equatorial positions. The full width at half maximum of these peaks tracks the spread of microfibril orientations relative to the bundle axis.
The Hermans orientation factor is calculated from the mean square cosine of the azimuthal distribution: a value of one represents total axial alignment, zero denotes random orientation, and minus one-half indicates a perpendicular arrangement. Geometric corrections convert the full width at half maximum into a mean microfibril angle while accounting for crystallite broadening and instrument geometry.
- Mount a parallel bundle of 50 to 100 washed elementary flax fibres in a low-background specimen holder under a constant axial tension of 0.05 centinewtons per tex.
- Align the specimen holder in the transmission path of a collimated X-ray beam with a spot diameter not exceeding 0.5 millimetres.
- Collect two-dimensional diffraction patterns using a pixel array detector for an exposure time sufficient to achieve a signal-to-noise ratio above thirty on the 200 reflection ring.
- Perform baseline subtraction and amorphous background fitting using an optical solvent-extracted matrix intensity model.
- Extract the 360-degree azimuthal intensity profile along the radial 200 diffraction maximum at two-theta equal to 22.6 degrees.
- Fit Gaussian or Voigt functions to the equatorial azimuthal intensity twin peaks to calculate the full width at half maximum and calculate the average microfibril angle.
How Does Matrix Lignin Obscure Microfibril Orientation Measurements?
Non-crystalline components ~ hemicellulose, pectins, and residual lignin ~ generate diffuse scattering halos that overlap crystalline cellulose peaks. In under-retted flax with elevated pectin levels, amorphous scattering under the 200 reflection artificially broadens the azimuthal profile, inflating calculated angles by up to 2.5 degrees if the background model is uncorrected.
| Flax Grade and Origin | Retting Method | 200 Peak Azimuthal FWHM | Hermans Orientation Factor | Mean Microfibril Angle | Specific Modulus |
|---|---|---|---|---|---|
| Water-retted Long Line (Normandy) | Controlled Tank Water | 14.2 degrees | 0.962 | 6.8 degrees | 68.5 GPa |
| Dew-retted Long Line (Flanders) | Field Dew Retted | 16.8 degrees | 0.941 | 8.1 degrees | 58.2 GPa |
| Dew-retted Tow (Heilongjiang) | Field Dew Retted | 21.5 degrees | 0.892 | 11.4 degrees | 41.0 GPa |
| Enzyme-retted Short Fibre (Oregon) | Pectinase Processed | 18.9 degrees | 0.920 | 9.8 degrees | 49.5 GPa |
Running wide-angle X-ray scattering on uncleaned, raw bundles risks conflating instrumental broadening with wide microfibril distributions caused by poor stem selection or over-retting structural damage.
Strain
Mechanics of Microfibril Alignment in Wet Spinning
Microfibril angle governs fibre response to drafting forces during yarn manufacture. In wet spinning, roving runs through a sixty degrees Celsius water bath to soften pectin bonds between cells, enabling elementary fibres to slide past each other under the drafting rollers to reach fine yarn counts. The cell’s microfibril angle sets the limit on how much tensile load an individual fibre can take before the cell wall shears internally.
In fine-count spinning, high-grade line flax averaging a 7.2 degrees microfibril angle maintains structural rigidity under draft tension without premature sliver breaks. The low fibril angle distributes tension along the cellulose crystallites. When the lot average climbs to 11.5 degrees, tensile loads resolve into larger shear forces across the amorphous matrix; the S2 layer delaminates earlier, driving up end-breakage rates on the spinning frame.
For a 10-tonne lot of dew-retted line flax intended for Nm 40 fine linen yarn, an average microfibril angle of 11.2 degrees instead of a specified 8.0 degrees forces drafting speed reductions of fifteen percent. Breakage rates rise from 35 to 82 breaks per 1000 spindle hours, and waste increases by 3.2 percent through broken slivers and fly, increasing raw material consumption per kilogram of finished yarn.
| Mean Lot Microfibril Angle | Maximum Runnable Count | Spinning End Break Rate | Yarn Tenacity at Nm 30 | Raw Material Cost Yield |
|---|---|---|---|---|
| 6.5 degrees | Nm 60 (10 Lea) | 22 / 1000 spindle hours | 38.5 cN/tex | Base baseline cost |
| 8.0 degrees | Nm 40 (15 Lea) | 36 / 1000 spindle hours | 32.1 cN/tex | Plus 1.8 percent cost shift |
| 10.0 degrees | Nm 26 (23 Lea) | 58 / 1000 spindle hours | 25.4 cN/tex | Plus 5.5 percent cost shift |
| 12.5 degrees | Nm 18 (33 Lea) | 104 / 1000 spindle hours | 18.2 cN/tex | Plus 12.1 percent cost shift |
Dry spinning tolerates broader microfibril angles because the process drafts coarse technical bundles where inter-bundle friction dominates over intra-cellular strength. Wet spinning exposes cell walls to direct draft forces, meaning minor variations in S2 helical orientation translate into count irregularity and broken ends.
Standard purchasing specifications for long-staple flax line intended for counts above Nm 39 require a mean S2 microfibril angle below 8.2 degrees as measured by wide-angle X-ray scattering.
Standard contract terms allow buyers to reclassify line flax to tow pricing or deduct 0.45 Euros per kilogram for every degree of tilt deviation if X-ray diffraction shows a lot’s mean microfibril angle exceeds the target threshold by more than 1.5 degrees.
Dossier
Bale Acceptance Protocols and Verification Frameworks
Incoming shipments require mill-gate sampling to ensure flax lots match microfibril specifications for fine yarn. Relying on supplier datasheets without independent verification risks processing failures on the spinning floor, making testing before bales enter the blend line essential.
Verification protocols follow a structured sequence of intake checks:
- Representative core sampling extracting ten 50-gram fibre plugs across opposing diagonal axes of a 200-kilogram bale, sampling five percent of the total lot delivery.
- Solvent degreasing and cleaning boiling samples in a 2 gram per litre sodium carbonate solution for thirty minutes to remove epicuticular waxes that impair optical diffraction clarity.
- Bundle parallelization combing cleaned fibres through a laboratory pin comb to remove nep structures and align individual fibres along a shared axial vector.
- Dual-method testing verification subjecting parallel specimens to wide-angle X-ray scattering for lot-averaged Hermans orientation factors and polarized Raman spectroscopy for local cell wall variance checking.
- Statistical distribution analysis plotting microfibril angle frequency histograms to confirm the coefficient of variation across the lot remains below twelve percent.
Angle variance across a delivery often points to mixed origins, where coarse basal fibres or over-retted stock were blended into line flax bales. Spotting a bimodal distribution curve during intake testing identifies blended stock before hackling and drawing.
Wide-angle X-ray diffraction tests on incoming fibre plugs must confirm a Hermans orientation factor equal to or exceeding 0.930 prior to lot release for fine count wet spinning.
Setting microfibril angle thresholds involves balancing testing overhead against spinning waste. Given the capital costs of X-ray diffraction equipment, many mid-sized mills rely on polarized light microscopy or external testing dossiers. The required sample size per lot to ensure statistical validity at a ninety-nine percent confidence level continues to be balanced between commercial spinning mills and testing laboratories.