X-Ray Diffraction Measurement of Microfibril Orientation in Bast Fibres
X-ray diffraction measures bast fibre microfibril angles via azimuthal peak distribution, setting hard physical limits on yarn tenacity and spinnable count.

Lattice
Cellular Architecture of Secondary Bast Walls
Flax microfibrils consist of crystalline cellulose domains embedded within a non-crystalline matrix of hemicellulose and pectins. The orientation of these crystalline domains relative to the longitudinal axis of the fibre elementary cell governs the axial stiffness, ultimate tensile strength, and flexural rigidity of the technical fibre bundle. In high-grade Linum usitatissimum, the secondary cell wall—specifically the thick middle layer often designated as the S2 layer—dominates the mechanical response, accounting for over eighty percent of the cell wall cross-sectional area.
The crystalline cellulose within this layer forms a left-handed helix winding around the cell lumen at a specific tilt angle designated as the microfibril angle.
Diffraction measurements exploit the regular atomic spacing within the monoclinic cellulose Iβ crystal lattice. When a monochromatic X-ray beam impinges on an aligned bundle of bast fibres, the parallel planes of the cellulose lattice diffract X-rays according to Bragg’s Law. The specific crystal plane corresponding to the cell wall longitudinal axis is the (200) reflection, which appears at a scattering angle of approximately 22.6 degrees 2-theta when using copper K-alpha radiation with a wavelength of 0.15418 nanometres.
The azimuthal dispersion of this (200) diffraction arc reflects the angular distribution of the cellulose microfibrils relative to the fibre fiber axis.
A narrow azimuthal diffraction arc at 22.6 degrees 2-theta indicates tight microfibrillar alignment along the cell axis, corresponding to elementary fibre breaking tenacities above 65 centinewtons per tex.
Variations in microfibril orientation occur naturally due to retting conditions, crop strain, and position along the stem. Basal stem fibres frequently display higher mean orientation angles than mid-stem line flax, introducing mechanical gradient variations within a single harvested lot. Measuring this orientation distribution by X-ray diffraction yields a direct, non-destructive metric of intrinsic fibre strength prior to mechanical hackling and wet spinning.
Crystallographic Orientation and Bast Species Parameters
Diffraction patterns distinguish technical flax from secondary bast fibres like hemp, jute, and ramie based on the sharpness and azimuthal spread of their primary equatorial reflections. While native ramie exhibits exceptionally high alignment with orientation angles below six degrees, commercial dew-retted flax exhibits a typical range between seven and fifteen degrees depending on crop maturity and scutching mechanical history.
| Fibre Type | Cellulose Content (% mass) | Mean Microfibril Angle (degrees) | Crystallinity Index (% WAXS) | Equatorial (200) Azimuthal FWHM (degrees) |
|---|---|---|---|---|
| Ramie (Degummed Line) | 83.0 – 87.0 | 4.5 – 6.5 | 68.0 – 74.0 | 8.2 – 11.5 |
| Flax (Long Line Grade) | 70.0 – 75.0 | 7.0 – 10.5 | 58.0 – 65.0 | 12.5 – 18.0 |
| Flax (Scutched Tow) | 64.0 – 70.0 | 11.0 – 15.5 | 52.0 – 58.0 | 19.0 – 26.5 |
| Hemp (Industrial Line) | 67.0 – 72.0 | 8.0 – 12.0 | 55.0 – 62.0 | 14.0 – 20.5 |
| Jute (Tossa Grade) | 59.0 – 64.0 | 12.0 – 18.0 | 45.0 – 53.0 | 21.0 – 30.0 |
Inaccurate determination of the equatorial arc profile distorts the calculated Hermans orientation factor, leading to misclassification of tow-grade fibre as long-line stock. Suppliers who skip background subtraction for amorphous pectin scattering risk overestimating the mean orientation angle by as much as three degrees, which understates the true tensile potential of the consignment.

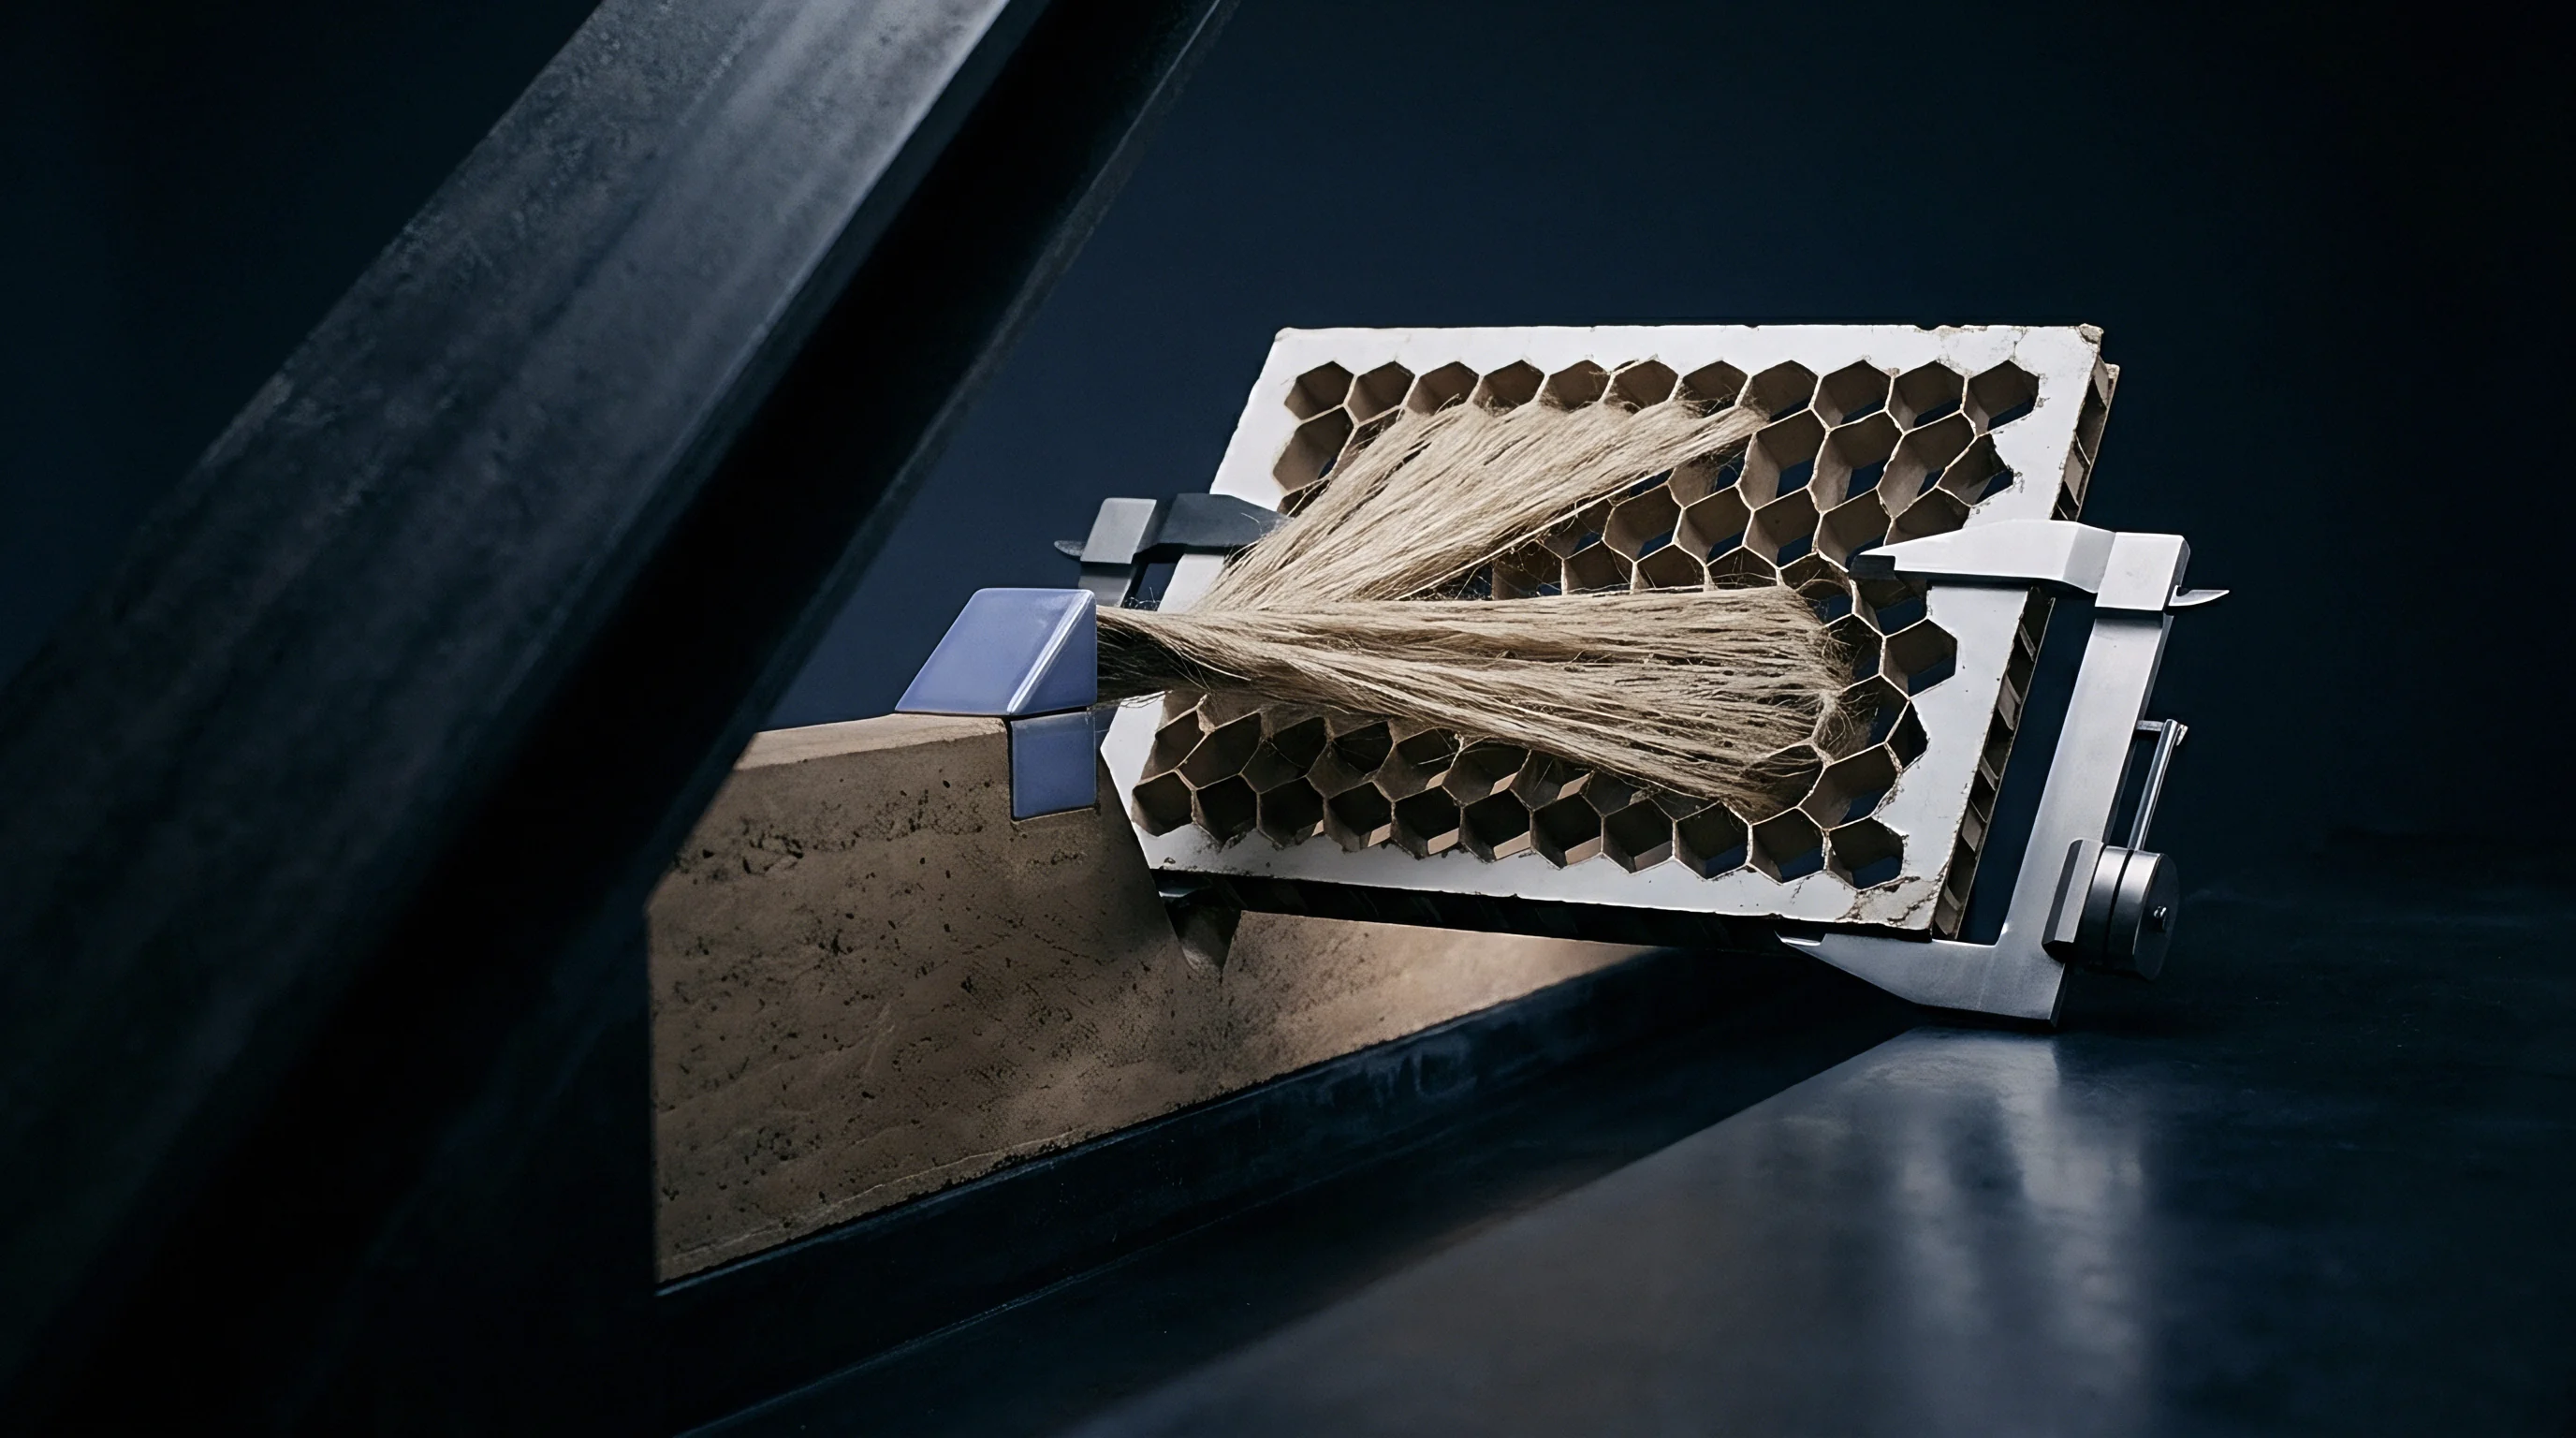
Mount

Bundle Preparation and Alignment Geometry
Preparing a homogeneous, parallel fibre specimen forms the primary physical requirement for reproducible wide-angle X-ray scattering measurements. Raw bast fibres naturally present twist, crimp, and variable cross-sectional bundle thickness. If unaligned fibres enter the X-ray beam path, the resulting diffraction rings blur azimuthally, generating an artificially wide intensity spread that corrupts the true microfibril angle calculation.
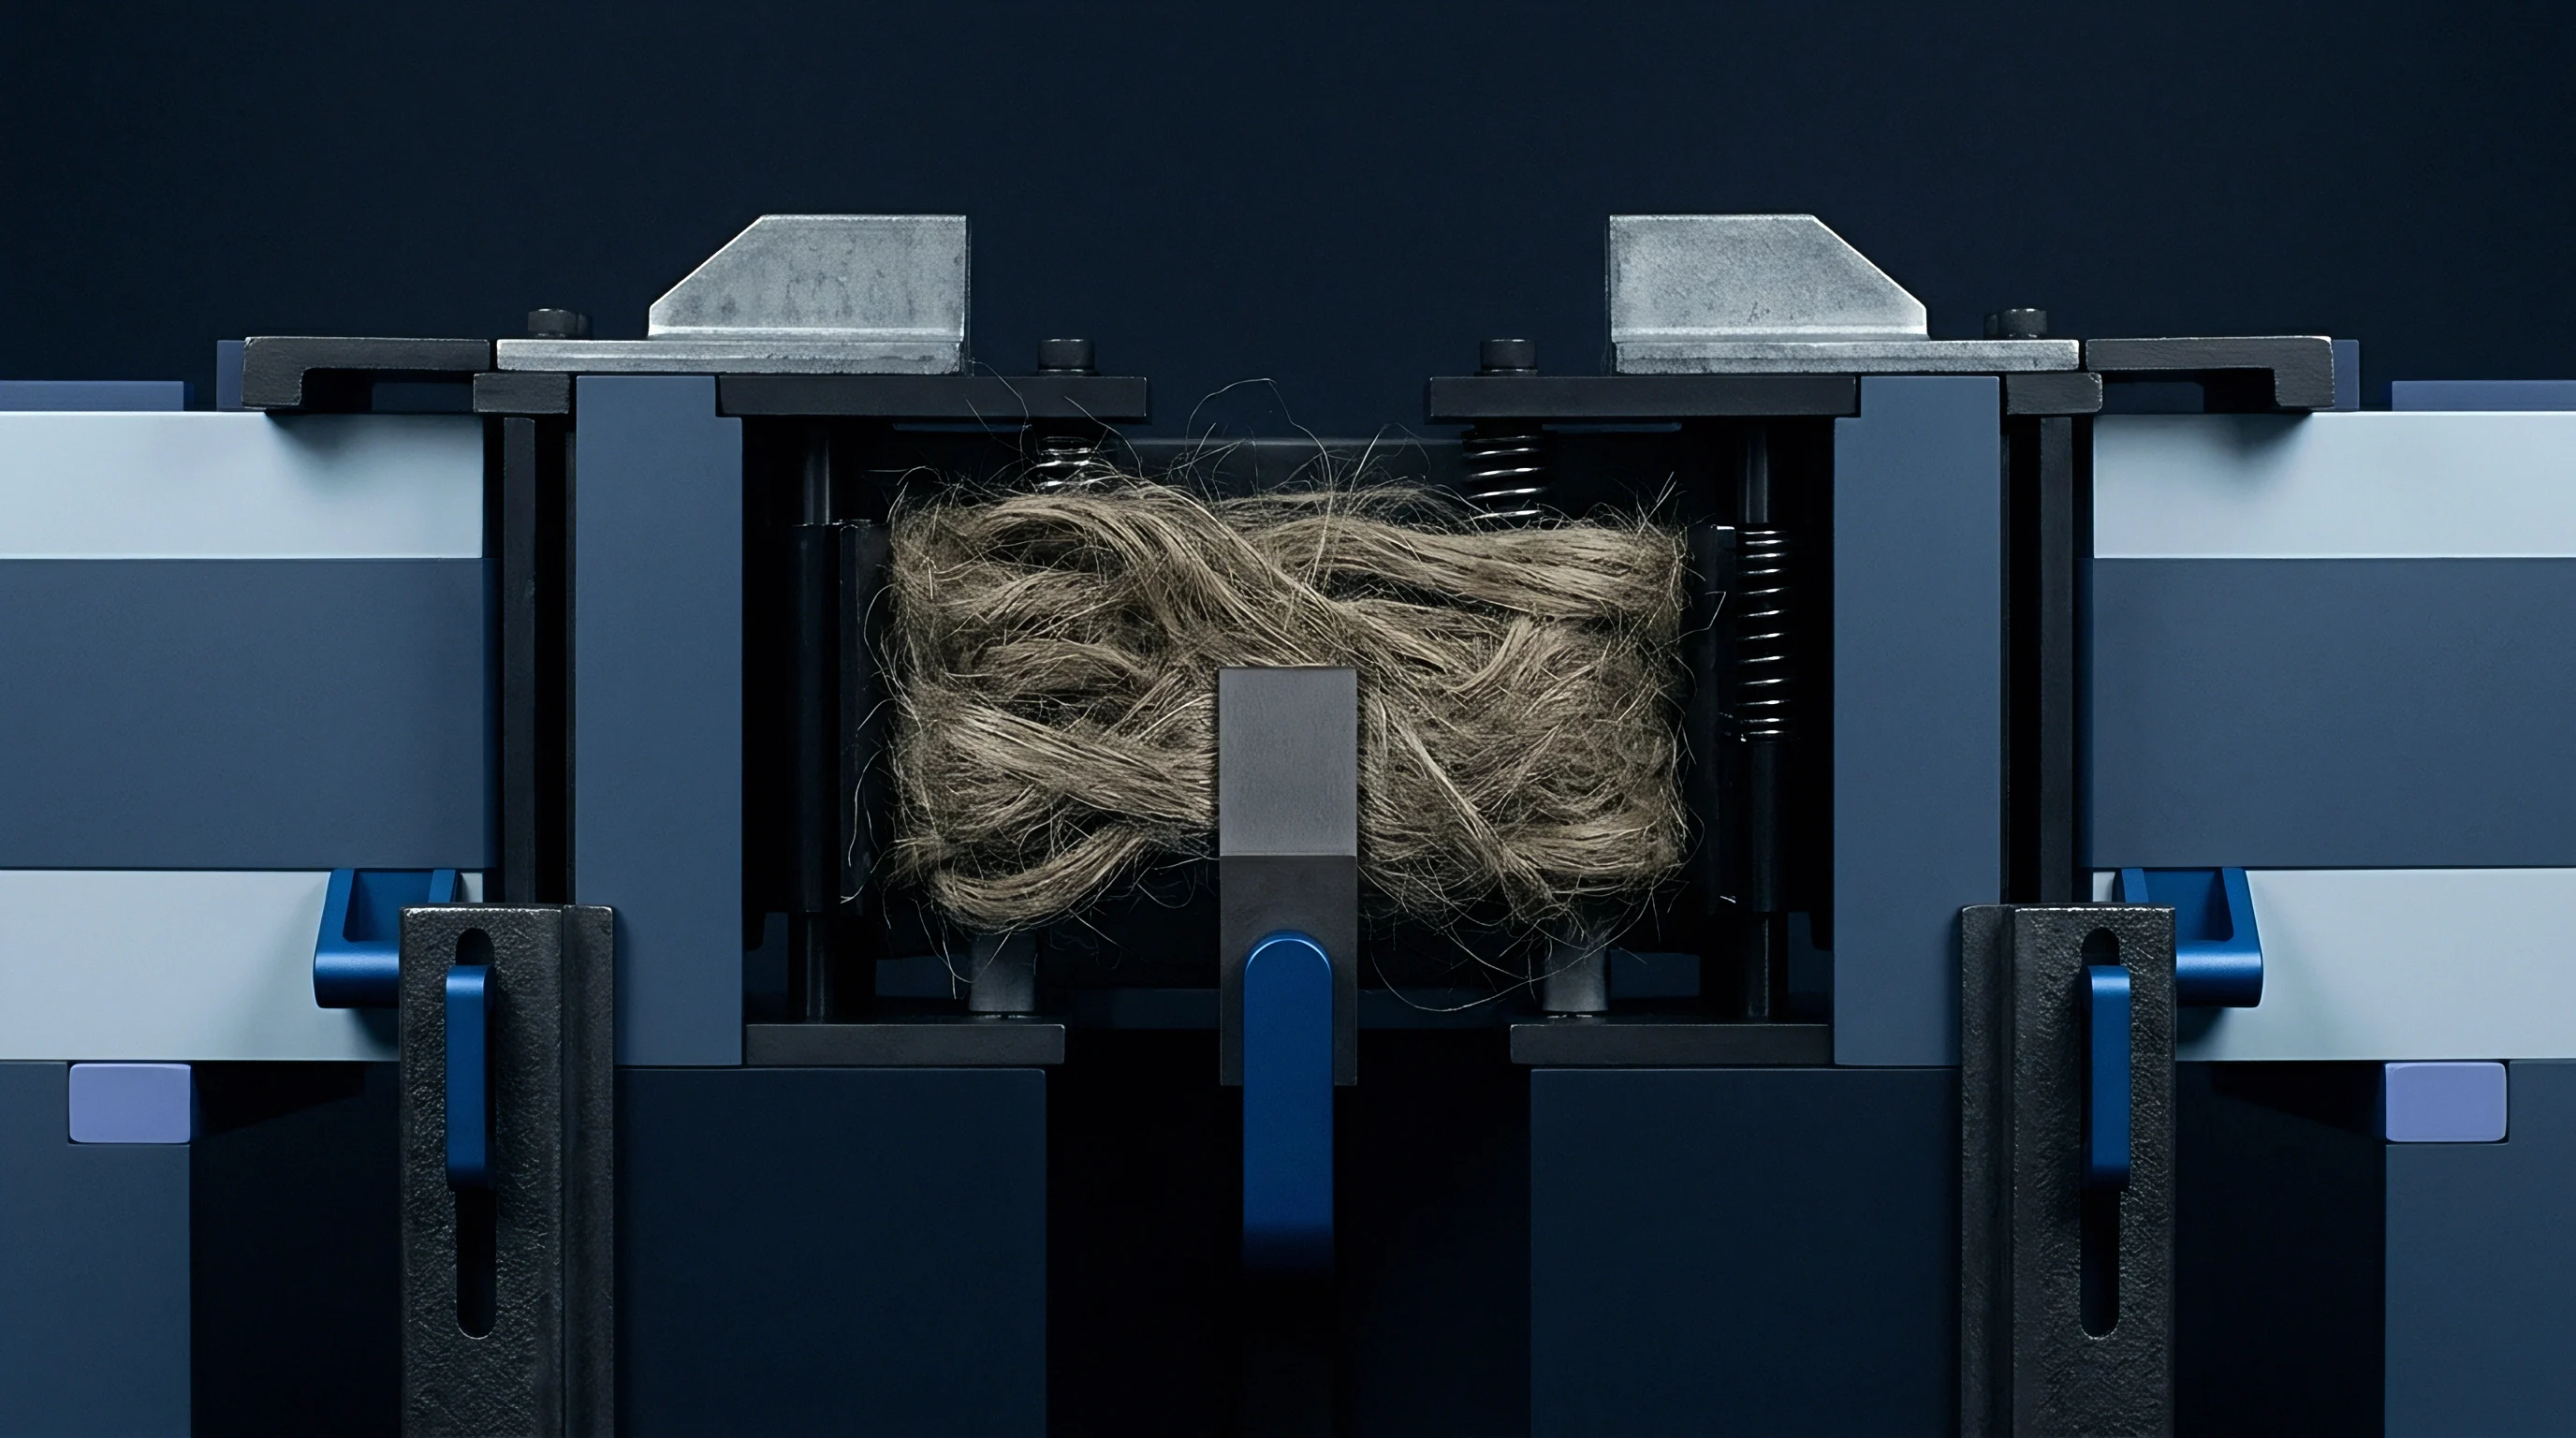
Specimen mounting requires a precision mechanical frame equipped with dual tensioning clamps. A weighed bundle of technical flax fibres, calibrated to a linear density between 150 and 300 tex, undergoes manual comb dressing to eliminate cross-over filaments and residual shive particles. Tensile prestress applied across the bundle removes macro-scale crimp without inducing plastic deformation or crystalline lattice distortion in the cell wall S2 layer.
Failure to maintain strict physical controls during mounting introduces significant measurement errors:
- Bundle crimp retention creates asymmetric azimuthal broadening on the 2D area detector, falsely widening the measured orientation distribution.
- Excessive pretension load exceeding fifteen percent of ultimate tensile load induces artificial lattice strain, shifting the equatorial Bragg reflections to lower angles.
- Variable specimen thickness along the beam path causes uneven X-ray absorption, distorting the relative integrated intensity of the (200) reflection.
- Adhesive contamination from mounting tapes introduces amorphous diffuse halos that overlap the crystalline cellulose equatorial peaks.
Sample Thickness Optimization and Mass Absorption Limits
Transmission geometry depends on optimizing specimen thickness against X-ray beam attenuation. For copper K-alpha radiation, the optimal path length through dense cellulose sits near 1.5 millimetres. Thicker bundles cause severe primary beam attenuation and secondary incoherent scattering, whereas excessively thin mounts yield insufficient signal-to-noise ratios, prolonging acquisition times and elevating detector noise floor contributions.
A precision specimen holder utilizes a rectangular aperture measuring 2.0 millimetres wide by 10.0 millimetres high. Standardizing the specimen mass within this aperture ensures constant total mass present in the beam footprint, permitting absolute intensity comparisons across different processing batches.
Suppliers claiming high microfibril alignment on uncombed tow stock usually rely on hand-held tape mounts that allow random fibre tilt relative to the goniometer plane.

Beam
X-Ray Optics and Detector Configuration
Diffraction hardware configurations directly dictate the spatial resolution and signal fidelity of the microfibril measurement. High-brightness sealed microfocus X-ray tubes coupled with multilayer optics deliver a monochromatic, highly parallel beam centered on the copper K-alpha wavelength. Modern wide-angle X-ray scattering setups utilize hybrid photon-counting area detectors positioned orthogonal to the incident beam line to record full 360-degree azimuthal intensity rings simultaneously.
Proper calibration of the beam line requires precise determination of the sample-to-detector distance, beam center coordinates, and tilt angles relative to the optical axis. Standard reference materials such as lanthanum hexaboride or cerium dioxide serve to calibrate the detector geometry, ensuring accurate conversion of pixel space to scattering angle 2-theta values.
| Instrument Parameter | Target Value / Setting | Tolerance / Limit | Operational Impact |
|---|---|---|---|
| X-Ray Wavelength | 0.15418 nm (Cu K-alpha) | Monochromatic (>99%) | Eliminates baseline distortion from K-beta emission |
| Beam Footprint Size | 0.5 mm x 0.5 mm | +/- 0.05 mm | Ensures representative sampling of bundle core |
| Sample-to-Detector Distance | 100.0 mm | +/- 0.2 mm | Balances 2-theta resolution with azimuthal range |
| Detector Pixel Size | 75 micrometres x 75 micrometres | Uncompressed | Resolves narrow azimuthal peak tops without pixelation |
| Exposure Time per Frame | 180 seconds | Minimum 100,000 photon count | Saturates crystalline peaks without detector overflow |
Rigid specimen mounts and parallel beam optics prevent peak convolution artifacts caused by bundle displacement along the optical path.

Parasitic Scattering and Alignment Errors
Parasitic scattering originating from anti-scatter slits, air ionization, and beam-stop edges elevates the low-angle background, obscuring weak crystalline reflections. Enclosing the flight path between sample and detector within a vacuum chamber or helium-purged flight tube dramatically reduces background noise, sharpening the distinction between crystalline Bragg peaks and amorphous background scattering.
Incorrect alignment of the fibre bundle perpendicular to the incident X-ray beam causes tilt distortion, making uniform equatorial diffraction arcs appear elliptical and skewed.
Which instrumental settings eliminate parasitic beam scatter? Installing a clean lead beam-stop positioned precisely three millimetres in front of the detector face completely absorbs the direct non-diffracted beam, preventing charge bleed and secondary scatter off the sensor window while preserving low-angle equatorial reflections.
The precise mechanics of beam-stop positioning remain a point of technical dispute between laboratory equipment manufacturers, leaving individual testing facilities to calibrate beam-stop shadow boundaries independently.

Profile

Azimuthal Intensity Extraction and Peak Fitting
Processing two-dimensional diffraction images into quantitative orientation metrics requires extracting the intensity distribution along the azimuthal angle phi at the fixed scattering angle of the (200) crystalline plane. Radial integration around the 2-theta interval between 22.0 and 23.2 degrees yields a 1D azimuthal profile showing two distinct equatorial intensity peaks separated by 180 degrees. The width and shape of these peaks contain the complete statistical distribution of microfibril orientations within the sampled fibre volume.
Baseline subtraction must precede peak shape analysis. Non-crystalline constituents, including amorphous cellulose, hemicellulose, lignin, and pectins, generate an isotropic background ring that contributes a uniform intensity offset across all azimuthal angles. Linear or polynomial baseline fitting across the non-diffracting azimuthal regions isolates the crystalline (200) reflection profile from matrix interference.
Mathematical deconvolution of the isolated (200) azimuthal peak relies on standardized mathematical steps:
- Baseline correction via isotropic background fitting across the non-peaked azimuthal baseline.
- Peak symmetry verification comparing the left and right halves of the primary equatorial peak at half-maximum intensity.
- Voigt function fitting separating Gaussian broadening caused by orientation distribution from Lorentzian broadening induced by finite crystallite size.
- Full Width at Half Maximum calculation measuring the angular width of the deconvoluted peak in degrees.
- Hermans orientation factor derivation integrating the intensity-weighted cosine squared distribution across the azimuthal domain.
Orientation Factor and Mean Microfibril Angle Calculation
The Hermans orientation factor quantifies the average alignment of the cellulose crystallites relative to the fibre axis. An orientation factor of 1.0 represents perfect parallel alignment, whereas an orientation factor of 0.0 indicates completely random spatial orientation. The mean microfibril angle relates directly to the Hermans factor through structural model assumptions that treat the cell wall as a uniaxial cylindrical assembly.
Converting the azimuthal Full Width at Half Maximum directly into a mean microfibril angle employs the empirical Cavalet formula or the rigorously derived Yamamoto relationship. In both models, a smaller angular peak width corresponds directly to a smaller mean microfibril angle, signaling superior intrinsic structural rigidity of the primary cell wall filaments.
Under standard ISO 17025 test protocols, reported microfibril angles must include the specific deconvolution model and baseline function used during image processing, as changing from a Gaussian to a Voigt peak model alters the calculated mean angle by up to 1.2 degrees on identical raw diffraction data.
Calculated orientation metrics feed directly into structural finite-element models designed to predict yarn tensile performance under high-speed mechanical draft.

Stiffness
Elastic Modulus Prediction and Cell Wall Mechanics
The axial Young’s modulus of an elementary flax fibre depends almost entirely on the microfibril angle of the S2 cell wall layer. Native crystalline cellulose holds an axial theoretical elastic modulus near 135 gigapascals. However, as the microfibril angle increases away from the longitudinal axis, the effective axial stiffness of the composite cell wall drops rapidly according to classical Voigt laminar mechanics, as transverse shear and matrix deformation begin to dominate the stress transfer process.
High-grade line flax displaying a microfibril angle between 7 and 9 degrees routinely yields elementary fibre moduli between 60 and 80 gigapascals. When the microfibril angle expands to 14 degrees, typical of lower-grade tow or over-retted stock, the modulus collapses to less than 35 gigapascals. This mechanical drop translates directly into increased elongation at break and reduced initial modulus on the finished yarn ring-spinning frame.
| Mean Microfibril Angle Range | Calculated Hermans Factor (f) | Fibre Modulus (GPa) | Tenacity Range (cN/tex) | Maximum Spinnable Wet-Spun Count (Nm) |
|---|---|---|---|---|
| 6.0 – 8.5 degrees | 0.96 – 0.98 | 65 – 85 | 68 – 85 | Nm 80 – Nm 120 |
| 8.6 – 11.0 degrees | 0.92 – 0.95 | 45 – 64 | 52 – 67 | Nm 50 – Nm 79 |
| 11.1 – 14.0 degrees | 0.86 – 0.91 | 30 – 44 | 38 – 51 | Nm 26 – Nm 49 |
| 14.1 – 18.0 degrees | 0.78 – 0.85 | 18 – 29 | 25 – 37 | Nm 10 – Nm 25 |
Microfibril alignment sets the absolute physical ceiling for yarn fineness and tensile strength before spinning twist is applied.

Does Lower Microfibril Angle Always Guarantee Higher Yarn Strength?
Extreme microfibril alignment increases axial stiffness but renders the elementary cell brittle under transverse shear and torsional flexure. When microfibril angles drop below 5 degrees, inter-fibrillar cleavage occurs under low transverse stress, causing longitudinal splitting during mechanical hackling. A balanced microfibril angle between 7 and 9 degrees provides the optimal compromise between axial tenacity, flexural toughness, and sliver drafting performance during high-speed wet spinning.
Sliver drafting force increases proportionally with fibre stiffness, requiring adjustments to the nip roller pressures in wet-spinning frames running highly oriented long-line flax lots.
Thick wall structures with low microfibril angles resist bending, generating stiff slivers that resist draft in wet frames.
Dossier

Technical Intake Specifications and RFQ Integration
Integrating wide-angle X-ray diffraction metrics into commercial procurement documentation eliminates reliance on subjective visual grading and hand-break feel. Contracts specifying high-tenacity wet-spun yarn counts above Nm 60 require explicit microfibril orientation thresholds verified by accredited laboratories. The specification clause establishes the maximum allowable mean microfibril angle alongside acceptable variance bounds across multi-bale consignments.
A complete technical dossier for incoming raw fibre or combed sliver specifies sample lot selection, X-ray operating conditions, peak fitting algorithms, and non-compliance thresholds. Incorporating these crystallographic metrics into quality assurance schedules protects spinners against hidden processing defects originating from bad weather during crop retting or mechanical over-processing at the scutching mill.
Formal qualification follows an established laboratory testing sequence:
- Sampling twenty random bales per forty-foot container according to ISO 2859-1 inspection levels.
- Extracting 5-gram bundle cores from each selected bale and conditioning at 20 degrees Celsius and 65% relative humidity for 24 hours.
- Mounting aligned 200-tex bundles under a constant 5-newton mechanical pre-tension.
- Acquiring 2D WAXS patterns across three distinct longitudinal points per specimen bundle.
- Calculating mean azimuthal FWHM and Hermans orientation factors using a standardized Voigt peak profile.
- Rejecting lots exceeding the agreed maximum microfibril angle threshold or displaying a coefficient of variation higher than eight percent.

Contractual Clauses and Acceptance Criteria
Commercial purchase agreements for high-grade combed flax line sliver include specific laboratory verification covenants to settle quality disputes:
Standard Quality Clause MFA-2026 ~ Crystalline orientation metrics shall be determined via transmission wide-angle X-ray diffraction using monochromatic copper K-alpha radiation. The average microfibril angle across the sampled shipment shall not exceed 9.5 degrees, with no individual specimen exceeding 11.0 degrees. Deliveries failing this threshold are subject to a 1.5 percent price discount for every 0.5-degree elevation in mean angle above the target, or complete rejection at the buyer’s sole discretion if the mean angle exceeds 12.0 degrees.
Disputes over XRD measurements are referred to an independent accredited testing institute, whose crystallographic finding remains final and binding on both parties.