Quantifying Flax Fibre Microcracking through Polarised Microscopy
Polarised light microscopy quantifies flax cell wall microcracks, enabling buyers to predict hackling yield, prevent wet-spinning breaks, and control landed cost.

Dislocation
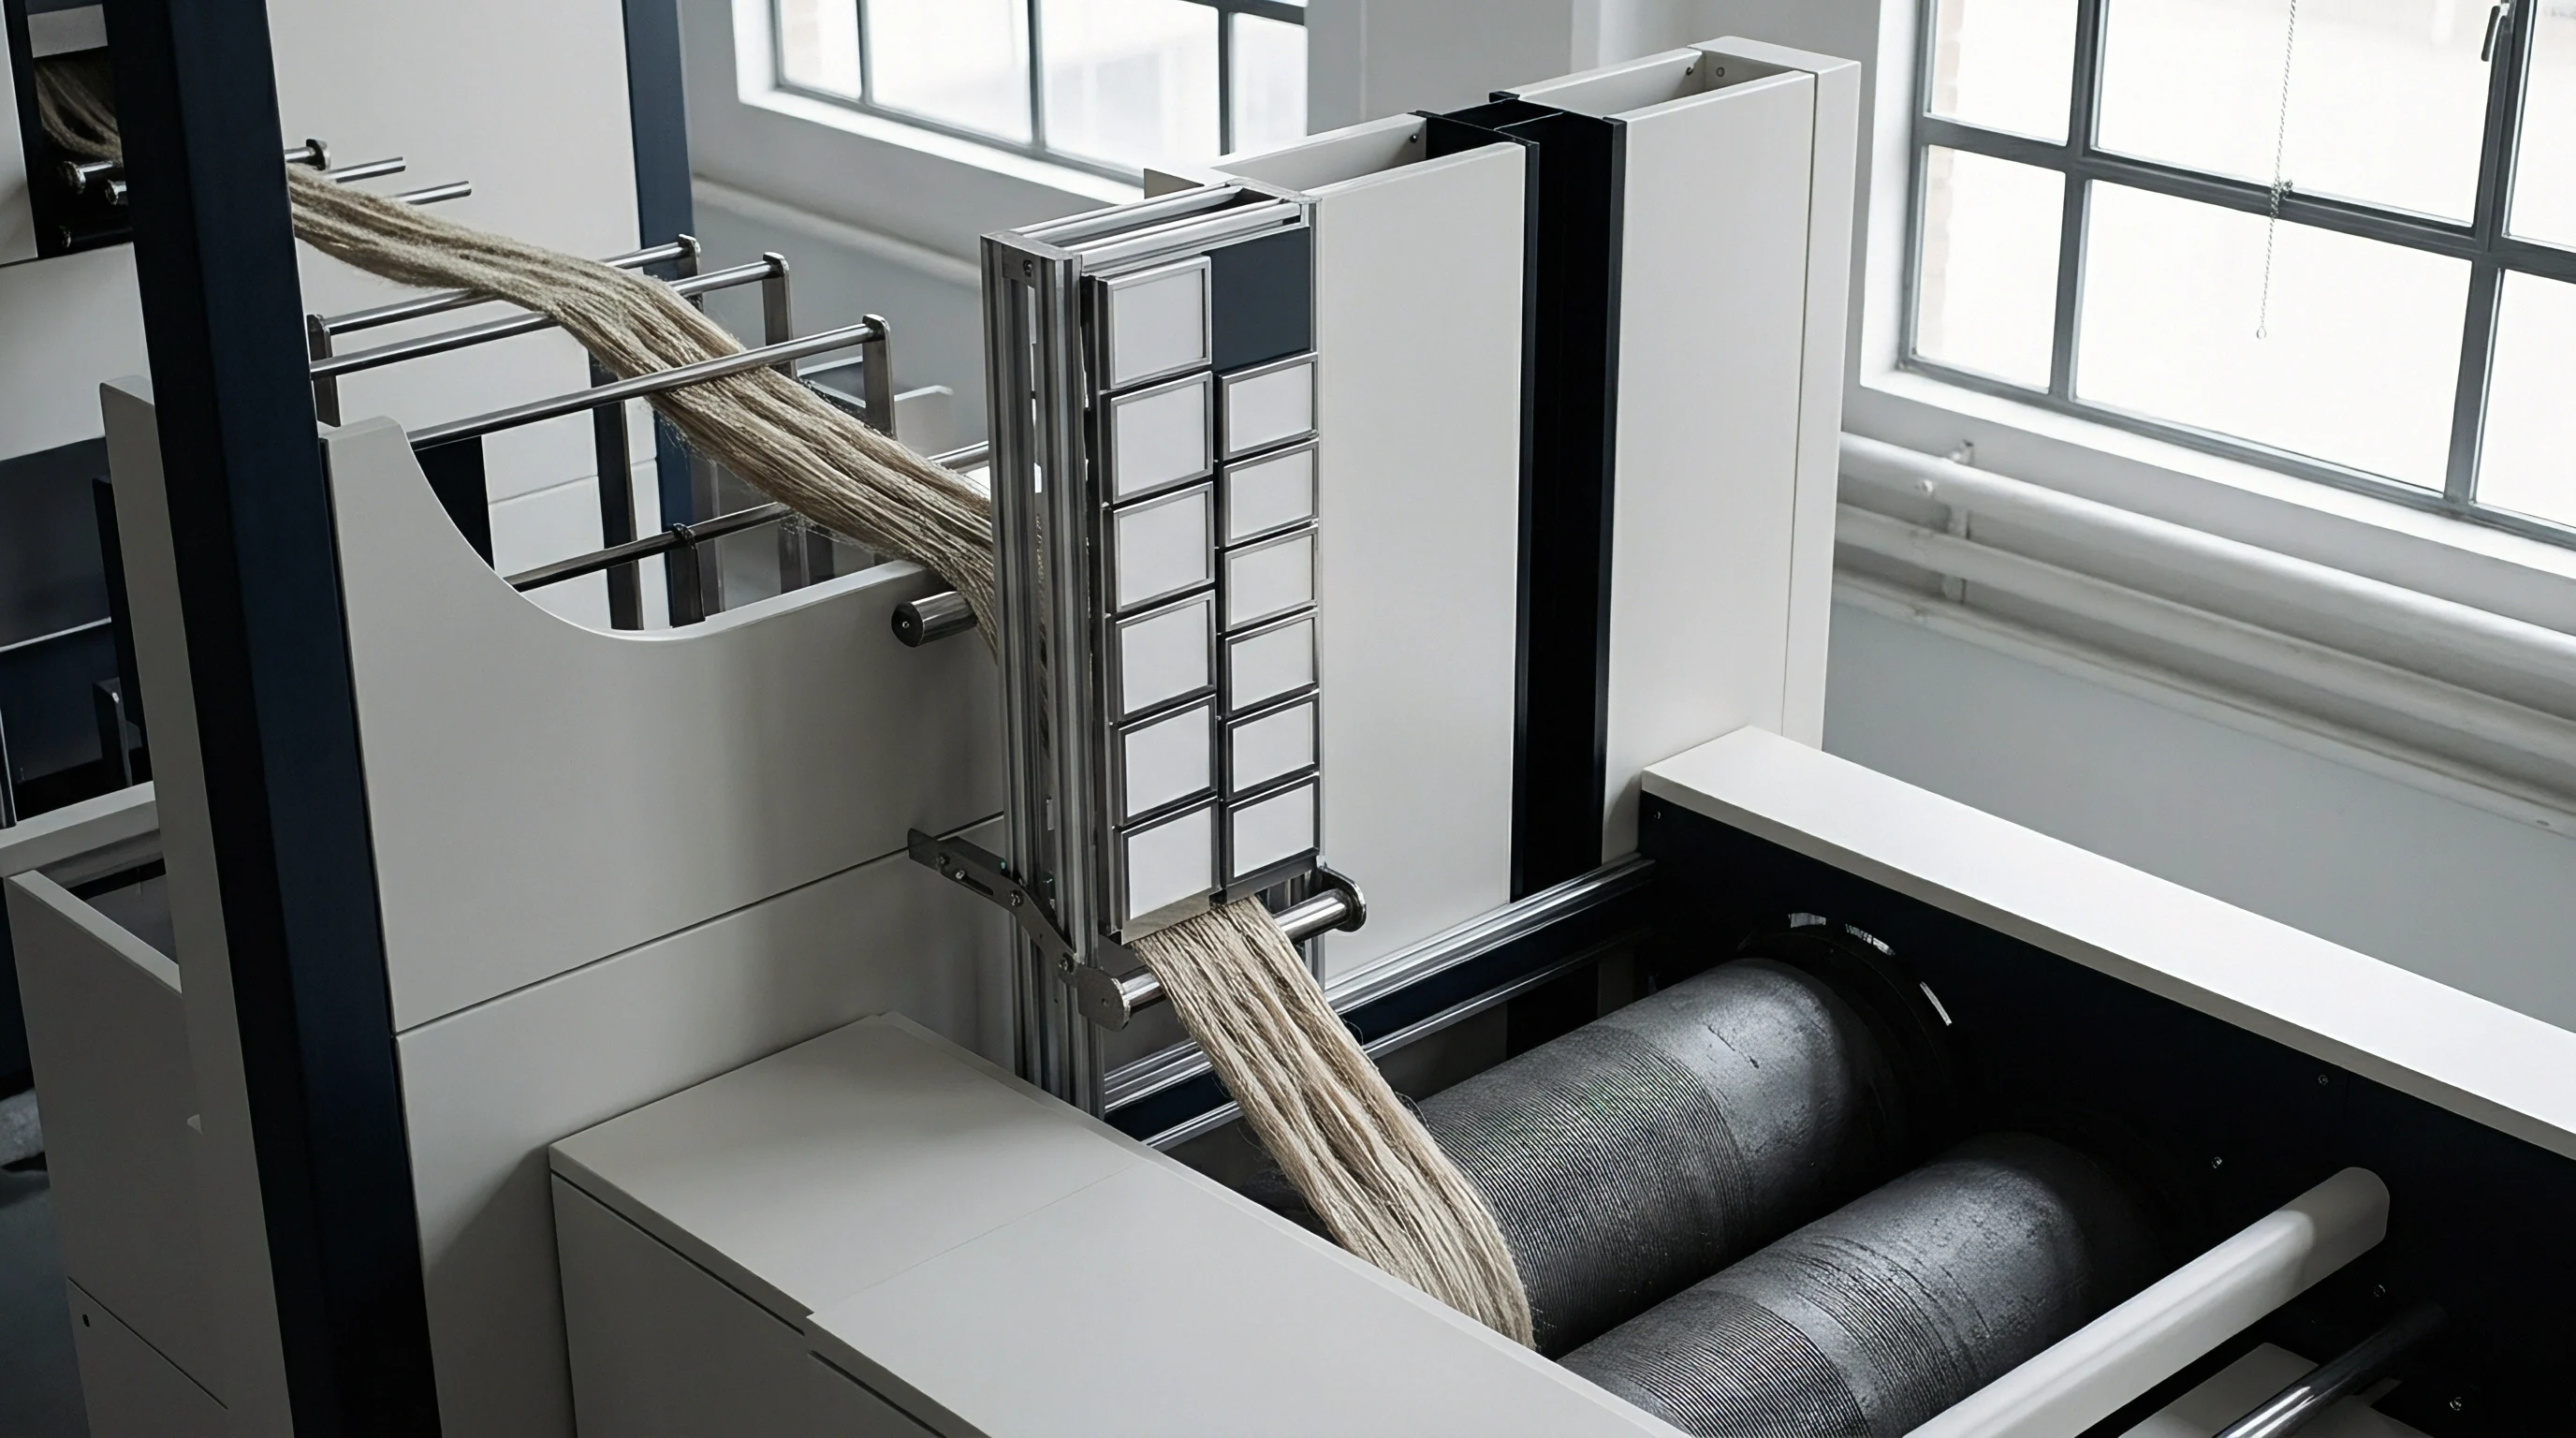
Mechanical extraction of bast ribbons from harvested flax stems subjects individual ultimate fibres to severe transverse shear and longitudinal compression. During breaker-roll passage and scutching fluting operations, woody shive tissue separates from surrounding phloem parenchyma under repeated impact. Decortication loads create transverse shears.
Secondary walls absorb bending stresses. Shive separation demands mechanical impact. The cellulosic skeleton of the secondary cell wall (specifically the thick S2 layer containing aligned cellulose microfibrils) deforms plastically when localized strain exceeds elastic limits.
This mechanical shock creates structural defect zones known as kink bands, micro-compressions, or microcracks.
Intact flax elementary fibres maintain a steep microfibrillar angle of approximately 6° to 10° relative to the main fibre axis. Microcracking displaces these crystalline cellulose fibrils from their parallel alignment, creating localized kink angles reaching 25° to 45°. At these structural discontinuities, the outer primary wall remains largely continuous, while the interior S2 layer exhibits sharp transverse crack planes, structural slippage, and localized density reductions.
The frequency and physical magnitude of these dislocation sites depend on retting uniformity, stem moisture during scutching, and mechanical clearance settings across processing machinery.
Fibre classers manually evaluate retting state by inspecting bundle flexibility and break resistance, yet visual grading fails to reveal internal S2 layer damage. Under-retted flax ribbons retain excessive pectinaceous middle lamellae, requiring higher mechanical force during decortication and generating elevated defect densities. Over-retted material suffers enzymatic decay of structural cell wall polysaccharides, lowering the threshold for mechanical shear fracture.
Scutching mills operating on dry flax at moisture levels below 8.5 percent produce severe microcracking populations across whole long-line lots.
Scutching flax bast ribbons at relative moisture levels under 8.5 percent elevates secondary wall dislocation density beyond 12.0 defects per millimetre of fibre length.

Structural Failure Modes in Bast Cell Walls
Mechanical damage within ultimate flax fibres manifests in distinct geometric configurations depending on the dominant stress state during extraction:
- Transverse Kink Bands occur under pure axial compression, creating narrow structural deformation zones angled at 45° to 60° across the cell wall.
- Flexural Shear Microcracks arise from localized bending over scutching blades, causing ladder-like transverse fracture planes through the full thickness of the S2 layer.
- Interlamellar Cleavage Defect surfaces when high shear stresses separate adjacent cellulose microfibril sheets, creating axial void spaces inside the secondary wall matrix.
- Torsional Dislocation Nodes form during aggressive mechanical hackling, creating spiral micro-fractures that wrap around the fibre lumen.
Crystalline cellulose resists axial strain. Mechanical impact forces structural reorientation. Under mechanical loading, these defect sites concentrate stress during downstream drafting, reducing individual elementary fibre tenacity from baseline values near 800 MPa down to less than 350 MPa.
Assessing microcrack population density provides direct insight into expected fibre performance prior to mechanical drawing and spinning operations.
Fibre lots exhibiting identical metric count and bundle tenacity often yield radically different yarn break rates due to unseen variations in secondary wall microcrack distribution. The degree to which microcrack spacing alters the stress transfer length across intact cell wall segments remains an active area of investigation for bast fibre physics.

Birefringence
Transverse structural discontinuities within native cellulose become optically measurable through polarised light microscopy. Native flax cellulose (cellulose I) belongs to a monoclinic crystal system exhibiting pronounced optical anisotropy. Undamaged secondary wall regions possess two distinct refractive indices: an extraordinary refractive index of approximately 1.595 parallel to the microfibril axis and an ordinary refractive index near 1.528 perpendicular to the axis.
This differential yields an intrinsic birefringence value near 0.067.
When an undamaged flax fibre sits on a microscope stage between crossed linear polarizers (orientations set exactly 90° apart), light propagating through the fibre splits into orthogonal polarized components. Rotating the fibre axis parallel to either the polarizer or analyzer axis produces complete optical extinction. Extinction occurs under crossed polarizers.
Undisturbed microfibrils extinguish simultaneously along the intact longitudinal domain because crystal axes remain uniformly aligned with the main fibre stem.
Microcracks rupture this optical alignment. At a kink band or transverse dislocation line, microfibrils tilt relative to the main fibre axis. When the main fibre axis aligns with the polarizer transmission direction, damaged zones fail to extinguish.
These dislocation zones permit light transmission, appearing as bright, luminescent transverse bands against the dark extinguished body of the intact fibre cell wall. The brightness and angular width of these bands quantify local microfibrillar misorientation.
| Fibre Structural Domain | Microfibril Angle to Axis (deg) | Extinction Position Alignment | Birefringence Retardation (nm) | Optical Behavior under Crossed Polarizers |
|---|---|---|---|---|
| Intact S2 Cell Wall | 6.0 – 10.0 | Parallel to Polarizer Axis | 480 – 540 | Complete Optical Extinction (Dark) |
| Minor Kink Band Zone | 15.0 – 24.0 | Shifted 8° to 12° from Axis | 320 – 410 | Moderate Light Transmission (Low Order Grey) |
| Severe Transverse Microcrack | 25.0 – 45.0 | Shifted 18° to 35° from Axis | 180 – 290 | High Light Transmission (Bright White/Yellow) |
| Interlamellar Void Space | Disordered | No Fixed Extinction Angle | 0 – 90 | Diffuse Optical Scattering |
Measuring extinction angle displacement requires a rotating microscope stage equipped with a vernier scale readable to 0.1°. The technician rotates the specimen from maximum transmission to minimum extinction, recording the angular offset. Intact flax cell walls exhibit sharp extinction within 1.5° of axial alignment.
Dislocation zones demonstrate broad extinction minima shifted by 8° to 28°, proving local crystalline misorientation. Optical path difference dictates retardation.
Standard inspection procedures under ISO 2370 specify specimen conditioning at 20°C and 65 percent relative humidity to eliminate moisture-induced refractive index shifts during retardation angle measurement.
Precision increases when matching immersion media refractive index to the outer primary wall (n = 1.540). Dry mounts produce light scattering at curved fibre boundaries, generating edge diffraction artifacts that mimic interior S2 microcracks. Glycerol or high-index synthetic oils eliminate surface reflections, isolating internal secondary wall retardation phenomena.
Fibre mounts prepared with mismatched immersion liquids generate false dislocation counts along curved fibre margins.

Foil
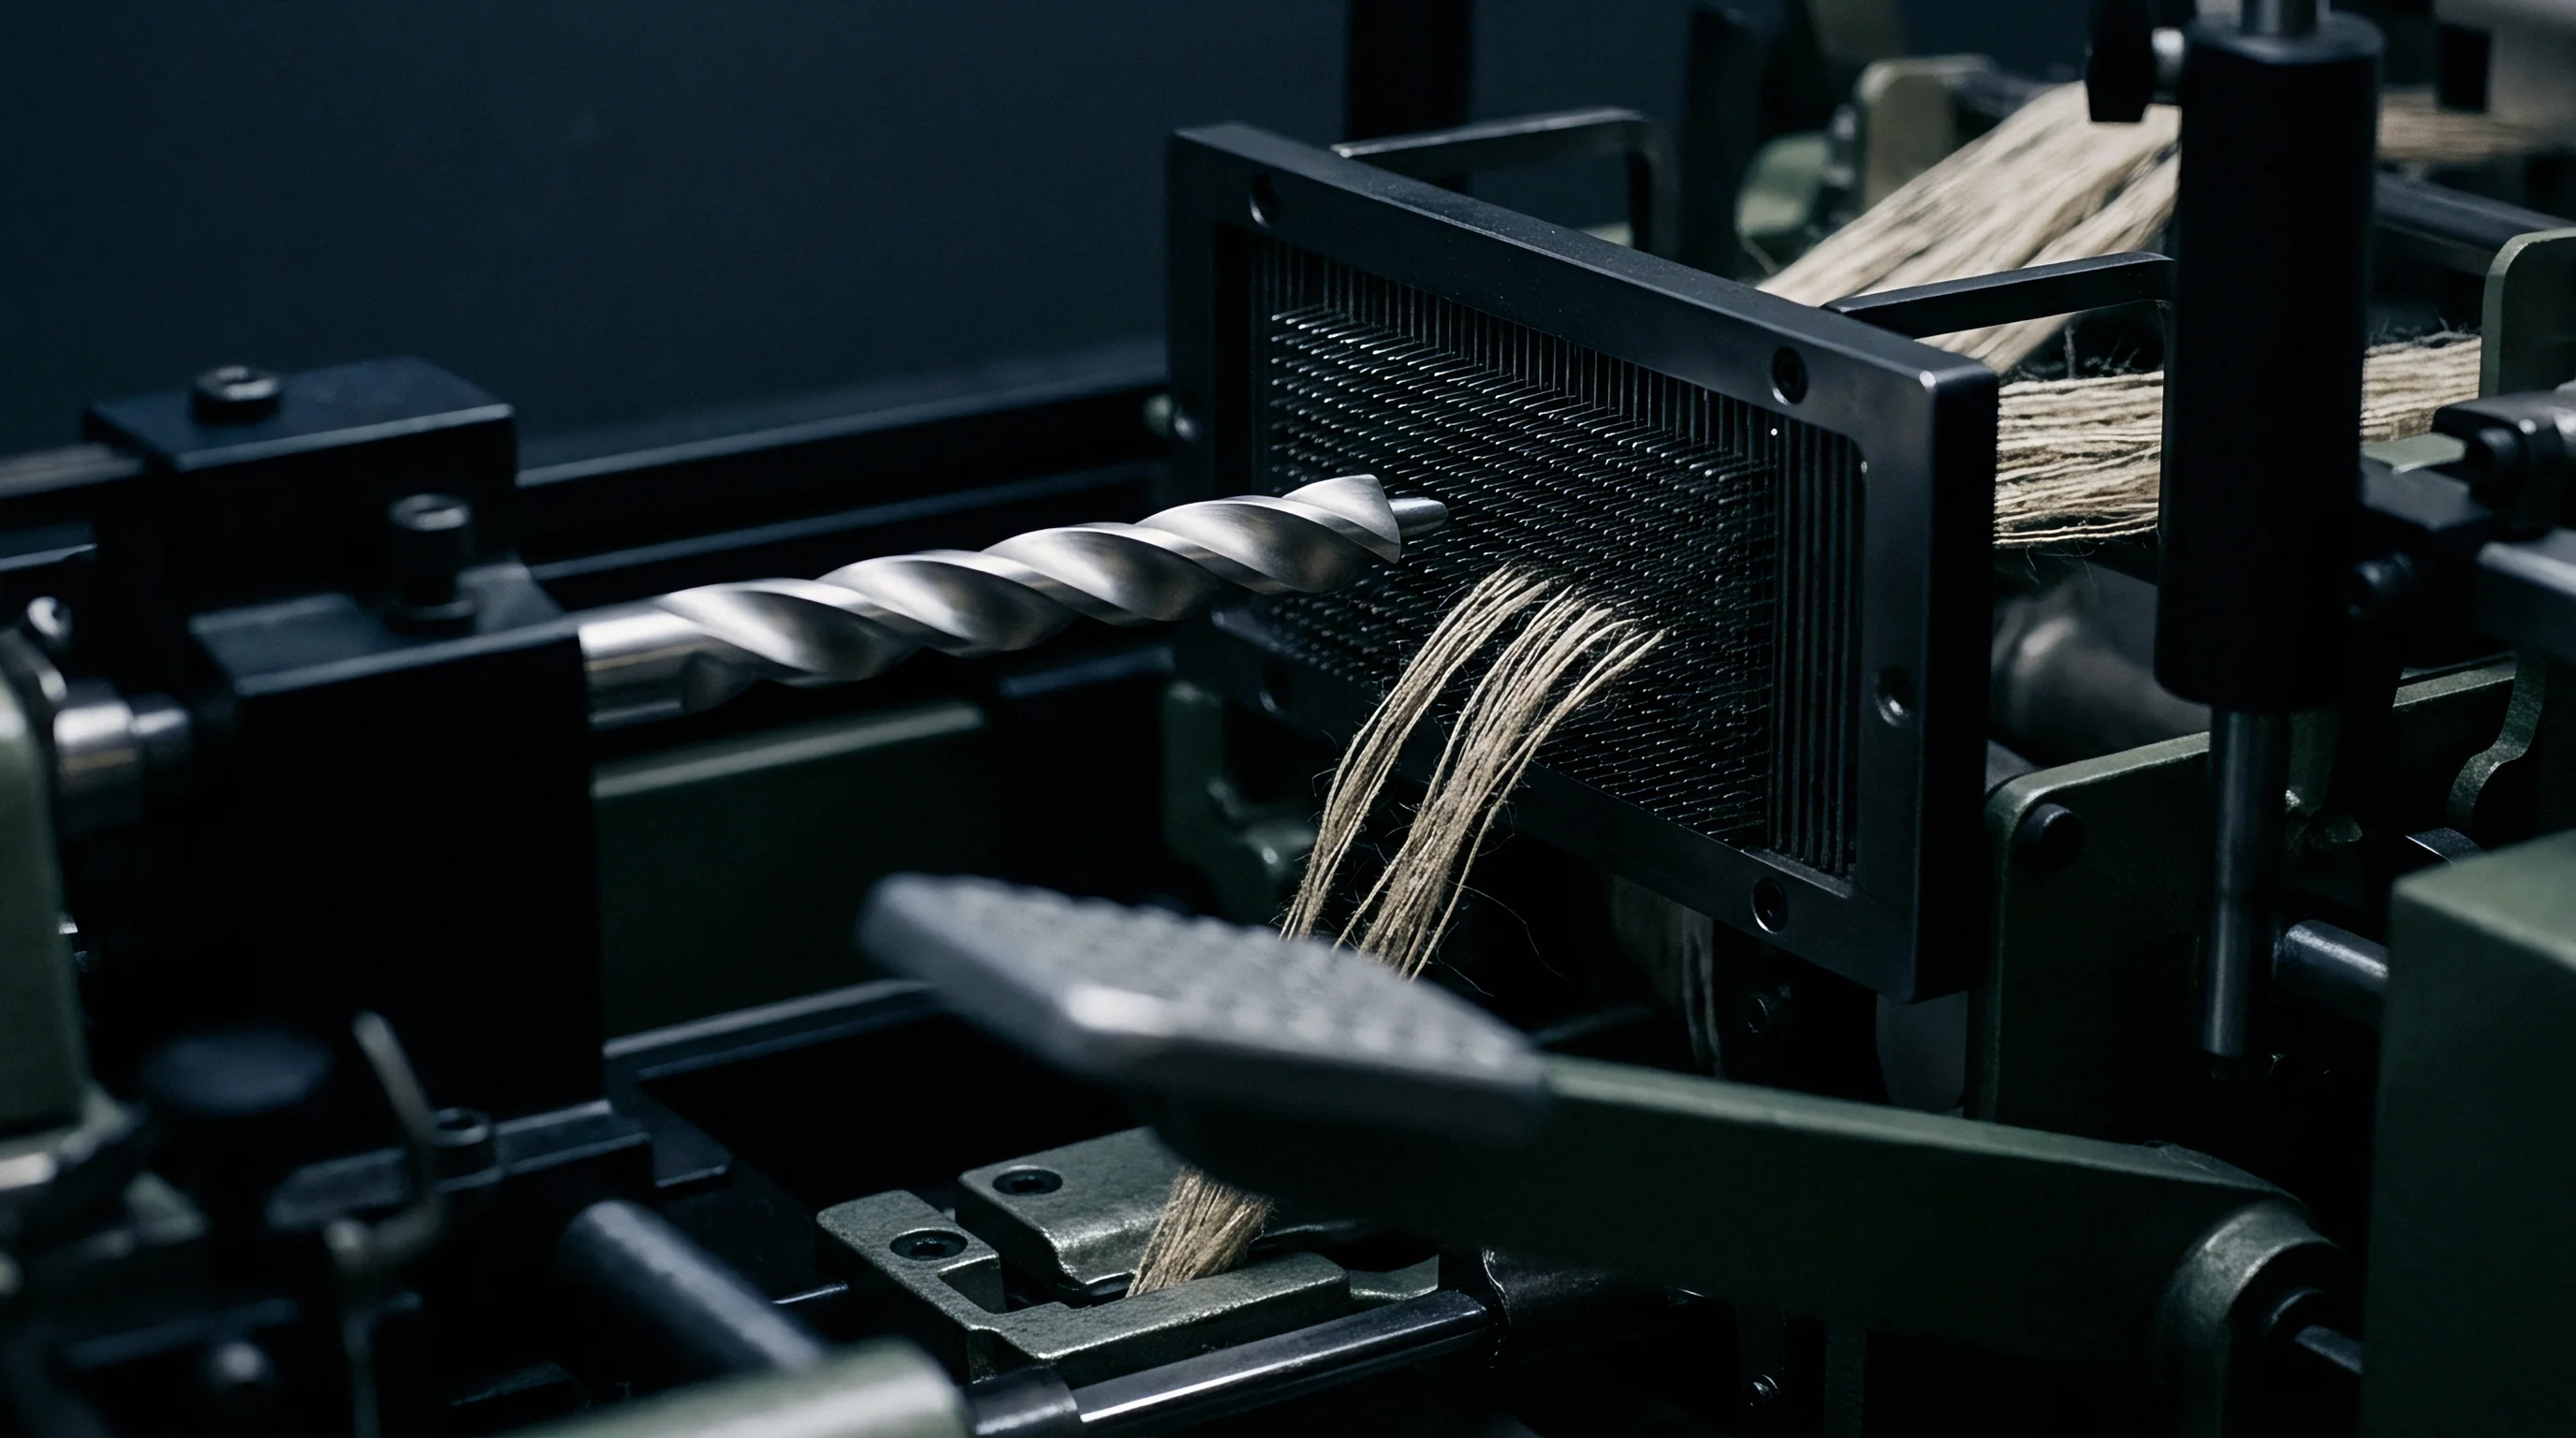
Quantifying subtle optical path variations inside microcracked cell walls demands optical enhancement beyond simple crossed polarizers. Inserting a full-wave retardation plate (commonly termed a first-order red plate, lambda plate, or tint foil) into the optical path at 45° to the polarizers introduces a uniform phase delay of exactly 530 to 550 nanometers. This phase shift converts the dark optical background of crossed polarizers into a uniform, neutral first-order magenta or magenta-red color field.
Tint plates shift background phase. Microcracks alter local extinction angles. When an undamaged flax fibre lies at 45° to the polarizers, its intrinsic retardation adds to or subtracts from the retarder foil phase.
Aligning the fibre microfibrils parallel to the slow axis of the retardation foil increases total optical path difference, shifting the observed interference color upward into second-order blue. Rotating the fibre perpendicular to the slow axis decreases total retardation, shifting the interference color downward into first-order canary yellow.
Dislocation bands disrupt this uniform interference display. Because cellulose microfibrils inside a microcrack tilt away from the primary fibre alignment, local retardation drops significantly. Under the lambda foil, an intact fibre displaying uniform second-order blue shows sharp, localized yellow or magenta transverse stripes precisely at microcrack locations.
Digital image analysis software isolates these distinct color bands using RGB channel thresholding, calculating microcrack linear frequency per unit length.

How Do Microcrack Count Thresholds Correlate with Single Fibre Tensile Loss?
Digital image processing translates qualitative optical interference patterns into numerical damage metrics. High-resolution CMOS cameras capture calibrated fields of view along single technical fibres. The segmentation algorithm executes a sequential workflow to determine dislocation density:
- Mount aligned flax ultimate fibres on glass slides using liquid paraffin or immersion oil with refractive index n = 1.540.
- Insert a 546 nm full-wave retardation foil into the optical path of the polarised light microscope at 45° relative to crossed Nicol prisms.
- Capture 2048×1536 pixel digital images at 200x total optical magnification using fixed exposure and gain settings.
- Convert the digital image to HSV (Hue, Saturation, Value) color space to isolate the specific yellow-cyan hue shifts produced by microcrack phase changes.
- Apply a skeletonization threshold filter to isolate linear dislocation bands oriented between 30° and 90° across the fibre width.
- Compute dislocation density (Dm) as total identified microcracks divided by measured fibre segment length in millimetres.
Defects concentrate local tensile stress. Systematic microcrack analysis across European long-line flax lots demonstrates a strong negative correlation between dislocation density and single-fibre tensile parameters. Intact technical fibres with microcrack densities below 3.0 defects per millimetre display average breaking tenacity near 42 cN/tex.
When mechanical processing raises dislocation density to 14.5 defects per millimetre, average breaking tenacity falls to 21 cN/tex, while elongation at break drops from 2.8 percent down to 1.4 percent.
Ignoring S2 secondary wall microcrack counts during fibre lot qualification leads directly to premature yarn breakage during high-speed wet spinning operations.
Automated image analysis requires strict calibration against manual optical counts. Software algorithms frequently misinterpret physical surface shive residue or twisted primary wall folds as internal S2 microcracks. Technicians validate digital threshold parameters by cross-checking manual extinction angle counts across every twentieth optical field.

Tension
The operational consequences of secondary wall microcracks materialize fully during industrial wet spinning. Wet spinning transforms treated flax roving into fine, strong linen yarn by drafting fibre bundles inside a hot water bath heated to 60°C – 70°C. Hot water softens middle lamellae. Pectinaceous inter-fibre binder matrices melt, permitting individual technical and elementary fibres to slide past one another under applied drafting roller tension.
Drafting forces isolate technical fibres. Undamaged flax fibres resist axial drafting stress, sliding past adjacent filaments until reaching the nip of the front spinning rollers. When microcracked fibres enter the drafting zone, applied draft tension concentrates directly at pre-existing S2 dislocation planes.
Rather than sliding cleanly past neighboring fibres, damaged ultimate fibres break apart at microcrack sites inside the water trough.
High end breaks stall frames. Fibre rupture inside the wet drafting zone generates short fibre fragments, ruining sliver drafting evenness. These broken structural elements cluster together, forming thick roving slubs or thin weak spots along the yarn axis.
Weak points containing ruptured microcracked fibres fail to survive ring-twisting tension, causing high end-breakage rates across wet-spinning frames.
| Yarn Target Count (Nm / Lea) | Fibre Lot Dislocation Density (Dm, mm⁻¹) | Roving Tenacity inside Trough (cN/tex) | Spinning End Breaks (per 1,000 Spindle Hours) | Delivered Yarn Tensile CVm (%) |
|---|---|---|---|---|
| Nm 26 (15 Lea) | 2.8 | 18.4 | 14 | 10.8 |
| Nm 26 (15 Lea) | 12.5 | 9.1 | 68 | 17.4 |
| Nm 39 (23 Lea) | 3.1 | 16.8 | 19 | 11.9 |
| Nm 39 (23 Lea) | 14.2 | 7.4 | 104 | 19.8 |
| Nm 60 (35 Lea) | 2.5 | 15.2 | 24 | 12.5 |
| Nm 60 (35 Lea) | 11.8 | 5.8 | 142 | 22.1 |
Spinning mills attempting to run fine counts (Nm 50 to Nm 80) using high-dislocation flax encounter severe production losses. Fine wet-spun yarns demand maximum individual fibre integrity because fewer fibres populate the yarn cross-section (often only 25 to 35 ultimate fibres per section at Nm 60). A single microcracked, broken fibre inside a fine yarn draft removes 3 to 4 percent of total load-bearing section, causing immediate thread failure.
Wet-spinning end breakage rates exceeding 45 stops per 1,000 spindle hours signal underlying cell wall dislocation densities above 9.0 microcracks per millimetre in raw hackled sliver.
Mills frequently attribute high end-breakage rates to incorrect trough temperature, improper draft distribution, or poor roving twist. Adjusting frame mechanical variables fails to resolve draft instability rooted in structural microcracking. Mechanical adjustments cannot restore broken S2 cellulose microfibrils inside damaged bast cell walls.
Spinning frame managers routinely blame water trough chemistry or speed settings when raw fibre lots carry excessive microcrack damage from aggressive scutching machinery.

Discount
Cell wall damage directly impacts financial yield across the flax-to-yarn transformation chain. Scutched flax purchasing relies on hackling yield estimates: the weight percentage of long-line combed fibre recovered after passing raw scutched ribbons through industrial hackling pins. Hackling waste reduces line yield.
Tow streams carry lower value. Intact flax cell walls withstand pin combing, yielding clean long-line sliver. Microcracked flax shatters under hackling pin impact, converting premium long-line material into short, tangled hackling tow.
Consider a commercial worked model evaluating a 20,000 kilogram lot of scutched flax priced at 4.85 per kilogram landed mill gate. Grade A intact raw material (dislocation density $Dm = 3.1 mm-1) delivers a hackling yield of 66 percent long line and 26 percent hackling tow, with 8 percent unrecoverable dust/shive waste. Grade C microcracked material (Dm = 13.8 mm-1) subjected to identical hackling settings delivers only 49 percent long line and 41 percent tow, with 10 percent waste.
| Quality Tier Parameter | Grade A (Low Microcracks) | Grade B (Moderate Microcracks) | Grade C (High Microcracks) |
|---|---|---|---|
| Raw Fibre Dislocation Density (Dm) | 3.1 mm⁻¹ | 7.4 mm⁻¹ | 13.8 mm⁻¹ |
| Hackling Long-Line Yield (%) | 66.0 % | 58.0 % | 49.0 % |
| Hackling Tow Recovery (%) | 26.0 % | 33.0 % | 41.0 % |
| Long Line Yield Volume (kg) | 13,200 kg | 11,600 kg | 9,800 kg |
| Tow Recovery Volume (kg) | 5,200 kg | 6,600 kg | 8,200 kg |
| Hackling Tow Market Value ($2.10/kg) | $10,920 | $13,860 | $17,220 |
| Net Net Cost of Recovered Line Fibre ($/kg) | $6.52 / kg | $7.17 / kg | $8.14 / kg |
| Wet Spinning Waste & Breakage Allowance | 4.5 % | 8.0 % | 15.5 % |
| Delivered Yarn Cost (Nm 39, $/kg) | $11.80 / kg | $13.65 / kg | $16.90 / kg |
| Landed Plain Weave Fabric Cost (200 g/m²) | $2.83 / metre | $3.28 / metre | $4.06 / metre |
Financial calculations demonstrate the severe penalty enforced by S2 cell wall damage. Long line fibre recovered from Grade C stock costs $8.14 per net kilogram, compared to $6.52 per kilogram for Grade A stock, even though both shipments arrived at the mill at the identical purchase price of $4.85 per raw kilogram. The financial penalty escalates downstream because Grade C long line requires lower frame speeds and higher breakage allowances during wet spinning.
Landed fabric cost escalates rapidly. A plain weave linen fabric (200 grams per square metre width 150 cm) produced from Grade A stock lands at $2.83 per running metre. The same fabric produced from Grade C stock lands at $4.06 per metre, representing a 43.4 percent cost inflation driven entirely by cell wall microcracking and associated spinning inefficiency.
Fibre price per kilogram represents a yield calculation first and a material description second.
Standard linen purchase contracts incorporating RNC (Rules of the European Flax and Hemp Trade) Clause 14 allow buyers to apply price discounts or reject deliveries when laboratory assay proves microcrack-induced hackling yield losses exceed 5.0 percent of contract baseline values.

Criterion
Establishing incoming quality standards for raw flax requires clear microcrack limits written directly into commercial purchase agreements. Technical buyers must replace traditional subjective hand-grading with quantitative polarised optical microscopy protocols. Bale sampling plans follow ISO 2370, specifying core sampling across 5 percent of delivered bales per shipment lot, drawing 50 individual technical fibres per sample core for laboratory mounting.
Contractual agreements define acceptable cell wall damage limits based on intended yarn target count. High-count long-line yarns require strict defect ceilings, whereas coarse dry-spun tow yarns tolerate elevated dislocation populations. The specification document sets measurable optical boundaries:
- Fine Count Line Flax (Nm 50 to Nm 80) limits average microcrack density to a maximum of 3.5 defects per millimetre, with no single test field exceeding 6.0 defects per millimetre.
- Medium Count Line Flax (Nm 26 to Nm 40) permits average microcrack density up to 6.0 defects per millimetre, with a maximum single-field ceiling of 9.5 defects per millimetre.
- Coarse Line & Tow Blends (Nm 10 to Nm 24) accepts average microcrack density up to 10.5 defects per millimetre prior to hackling preparation.
- Optical Retardation Shift Limit enforces that no more than 12 percent of evaluated S2 wall area may show extinction angle shifts greater than 15° under crossed polarizers.
Verification protocols demand dual-testing using both crossed polarizers and full-wave lambda retardation foils. Laboratory technicians record 20 fields per fibre slide, calculating mean dislocation frequency and coefficient of variation (CVd) across the submitted sample lot. Samples exceeding threshold limits generate automated non-conformance reports, triggering price adjustments or lot rejections prior to bale opening.
Integrating polarised microscopy into raw fibre procurement prevents processing weak, over-scutched flax lots. Sourcing technologists who measure secondary wall microcracks before writing purchase orders protect spinning yield, stabilize yarn tenacity, and fix landed fabric costs before a single bobbin turns on the frame.