Calibrating Image Analysis Algorithms for Irregular Flax Fiber Cross Sections
Digital cross-section area calibration requires dynamic edge thresholding to prevent fineness errors that distort spinnable yarn count limits.
Lumen
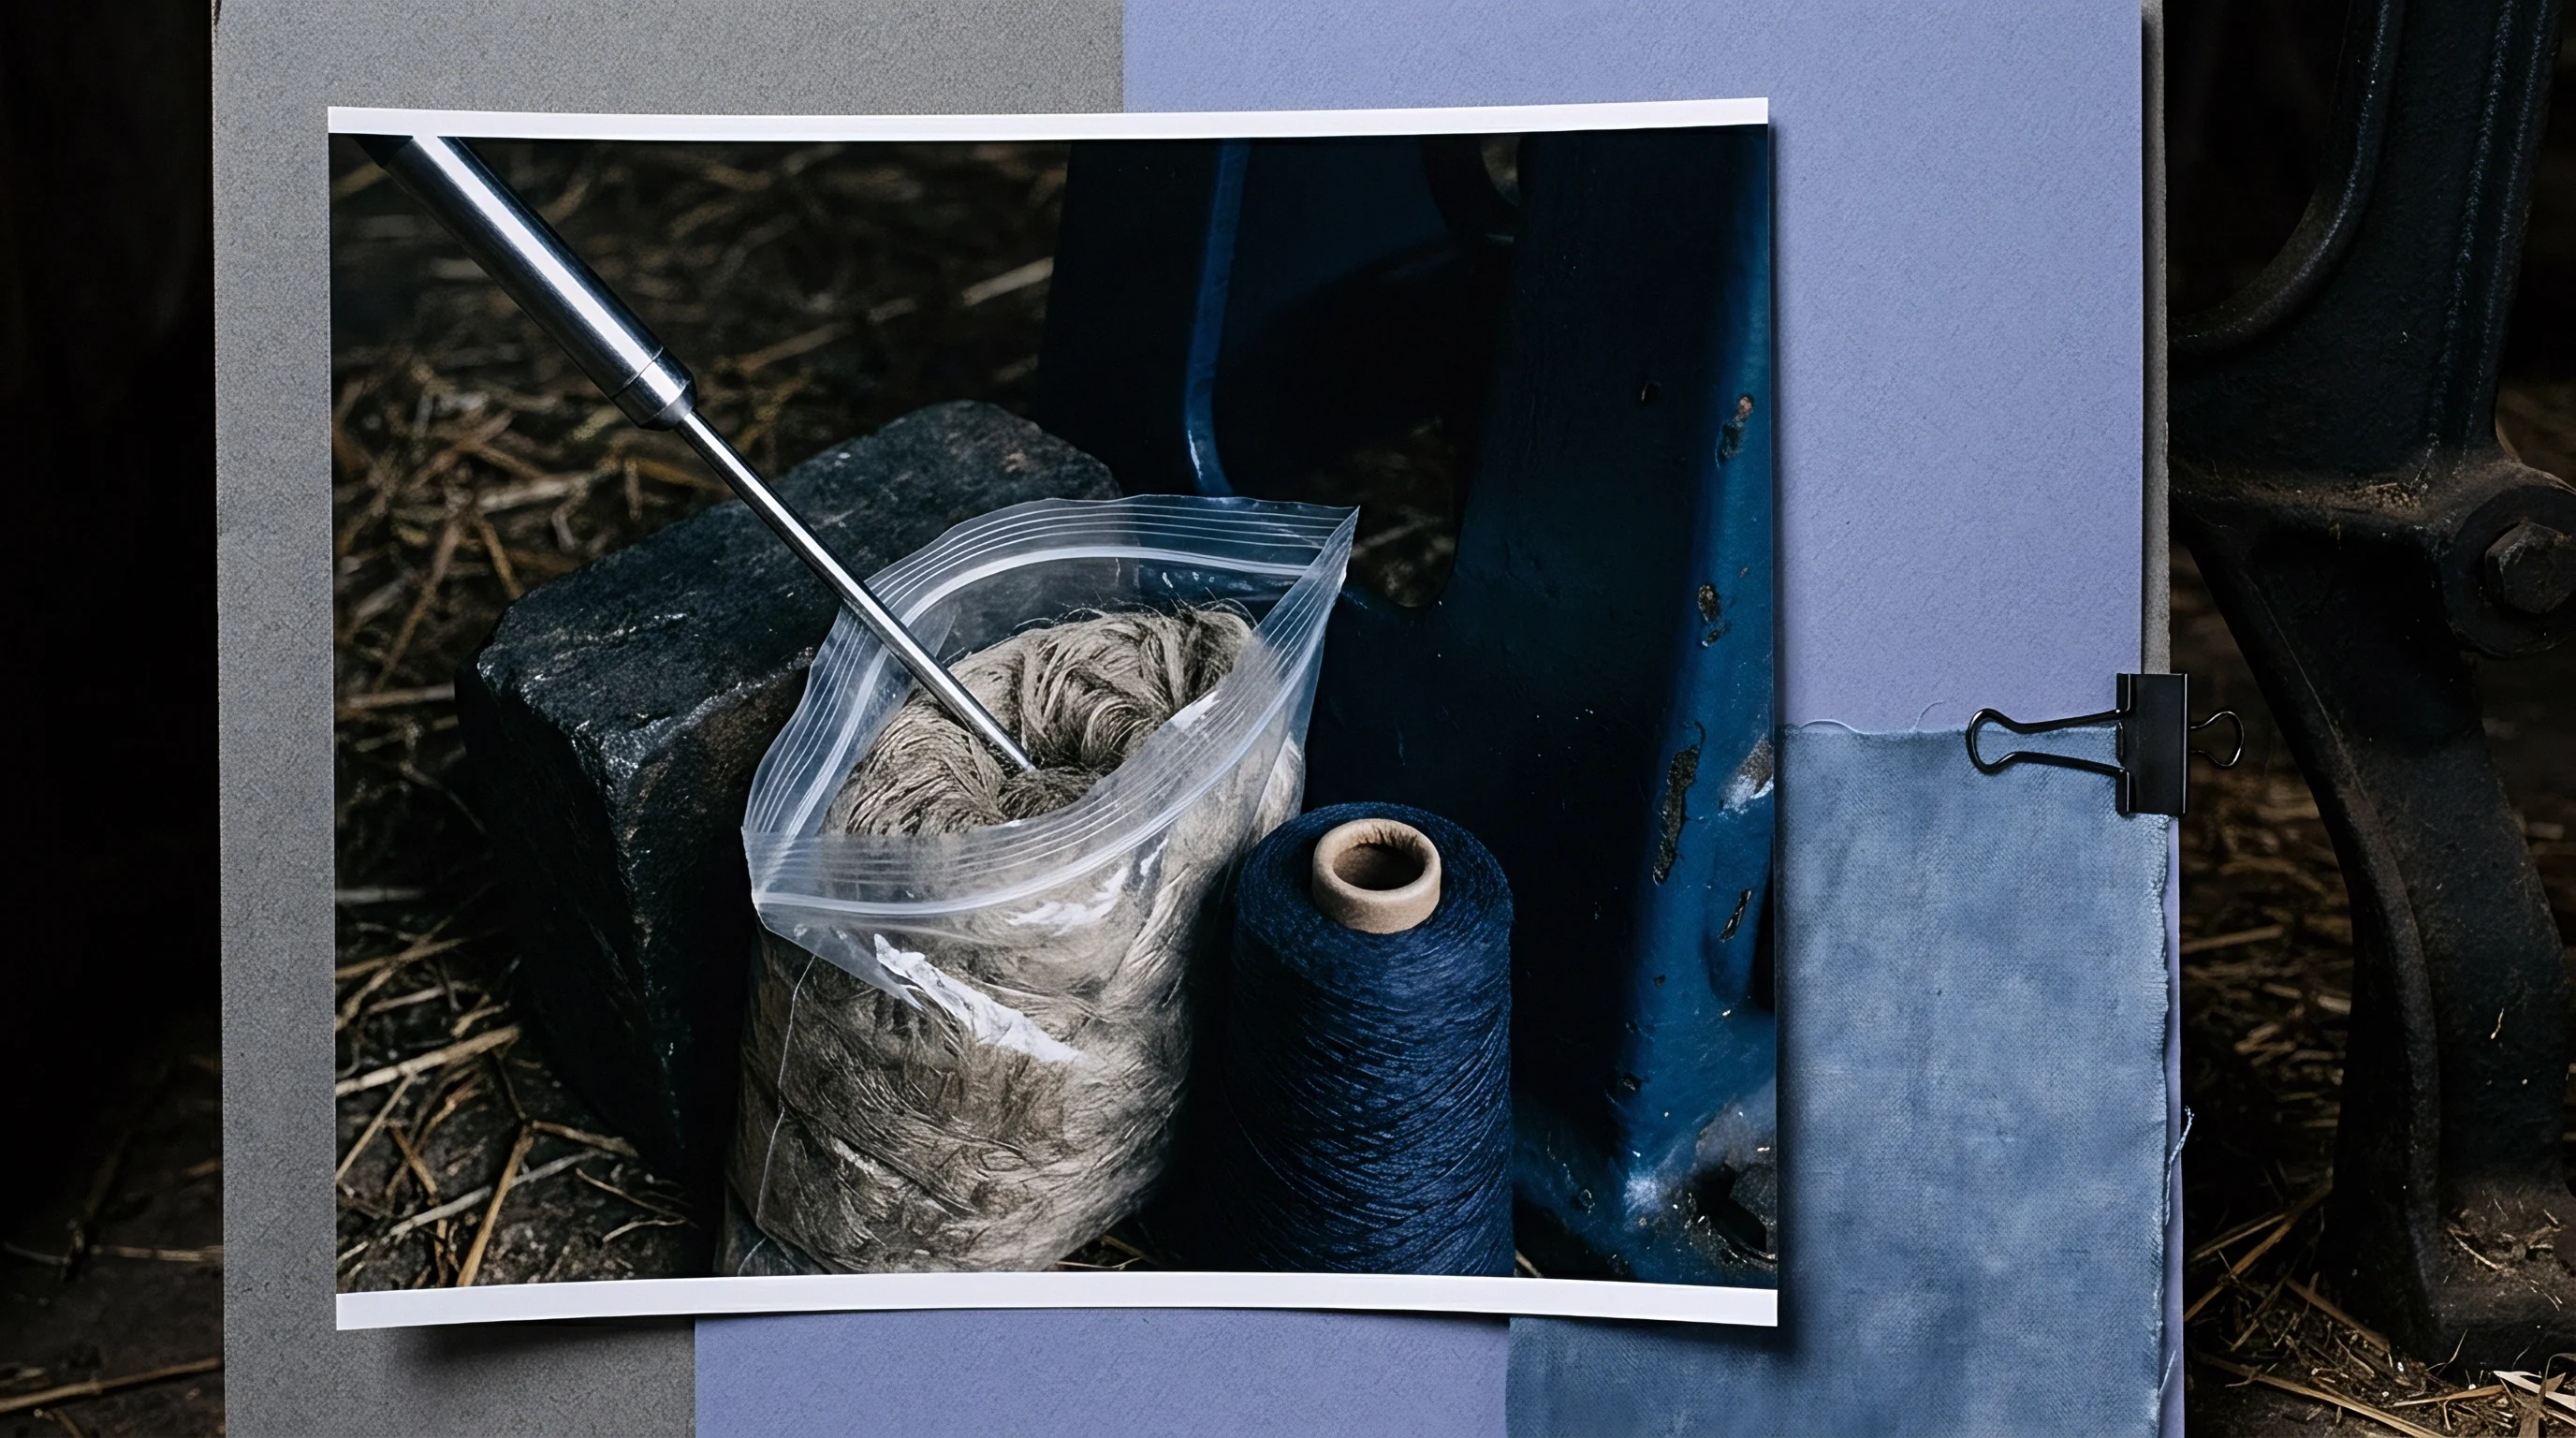
Bast fibre strands extracted from Linum usitatissimum form irregular polygons across their cross sections instead of smooth circles. Field growth, natural retting, and mechanical scutching leave elementary fibres with five to seven flat facets surrounding central voids. These cavities, or lumens, fluctuate in size with stem height, plant maturity, and harvest conditions.
Calculating fineness from external perimeters or an assumed circular radius overestimates solid cell wall area by fifteen to thirty-five percent, distorting gravimetric linear density values expressed in tex or dtex.
Flax cell walls consist of crystalline cellulose microfibrils bound within a hemicellulose and pectin matrix. Dry cellulose has a polymer density between 1.50 and 1.54 grams per cubic centimetre. Calculating the true mass of a technical bundle requires separating the net solid area of the wall from open lumen space.
Optical systems that model the perimeter as a solid ellipse convert empty central voids into phantom fibre mass. Because bast stems hold bundles of shifting size and water retting thins the pectin middle lamellae unevenly, the resulting polygons defy simple circular geometry.
Technical Fibre Bundles and Elementary Cells
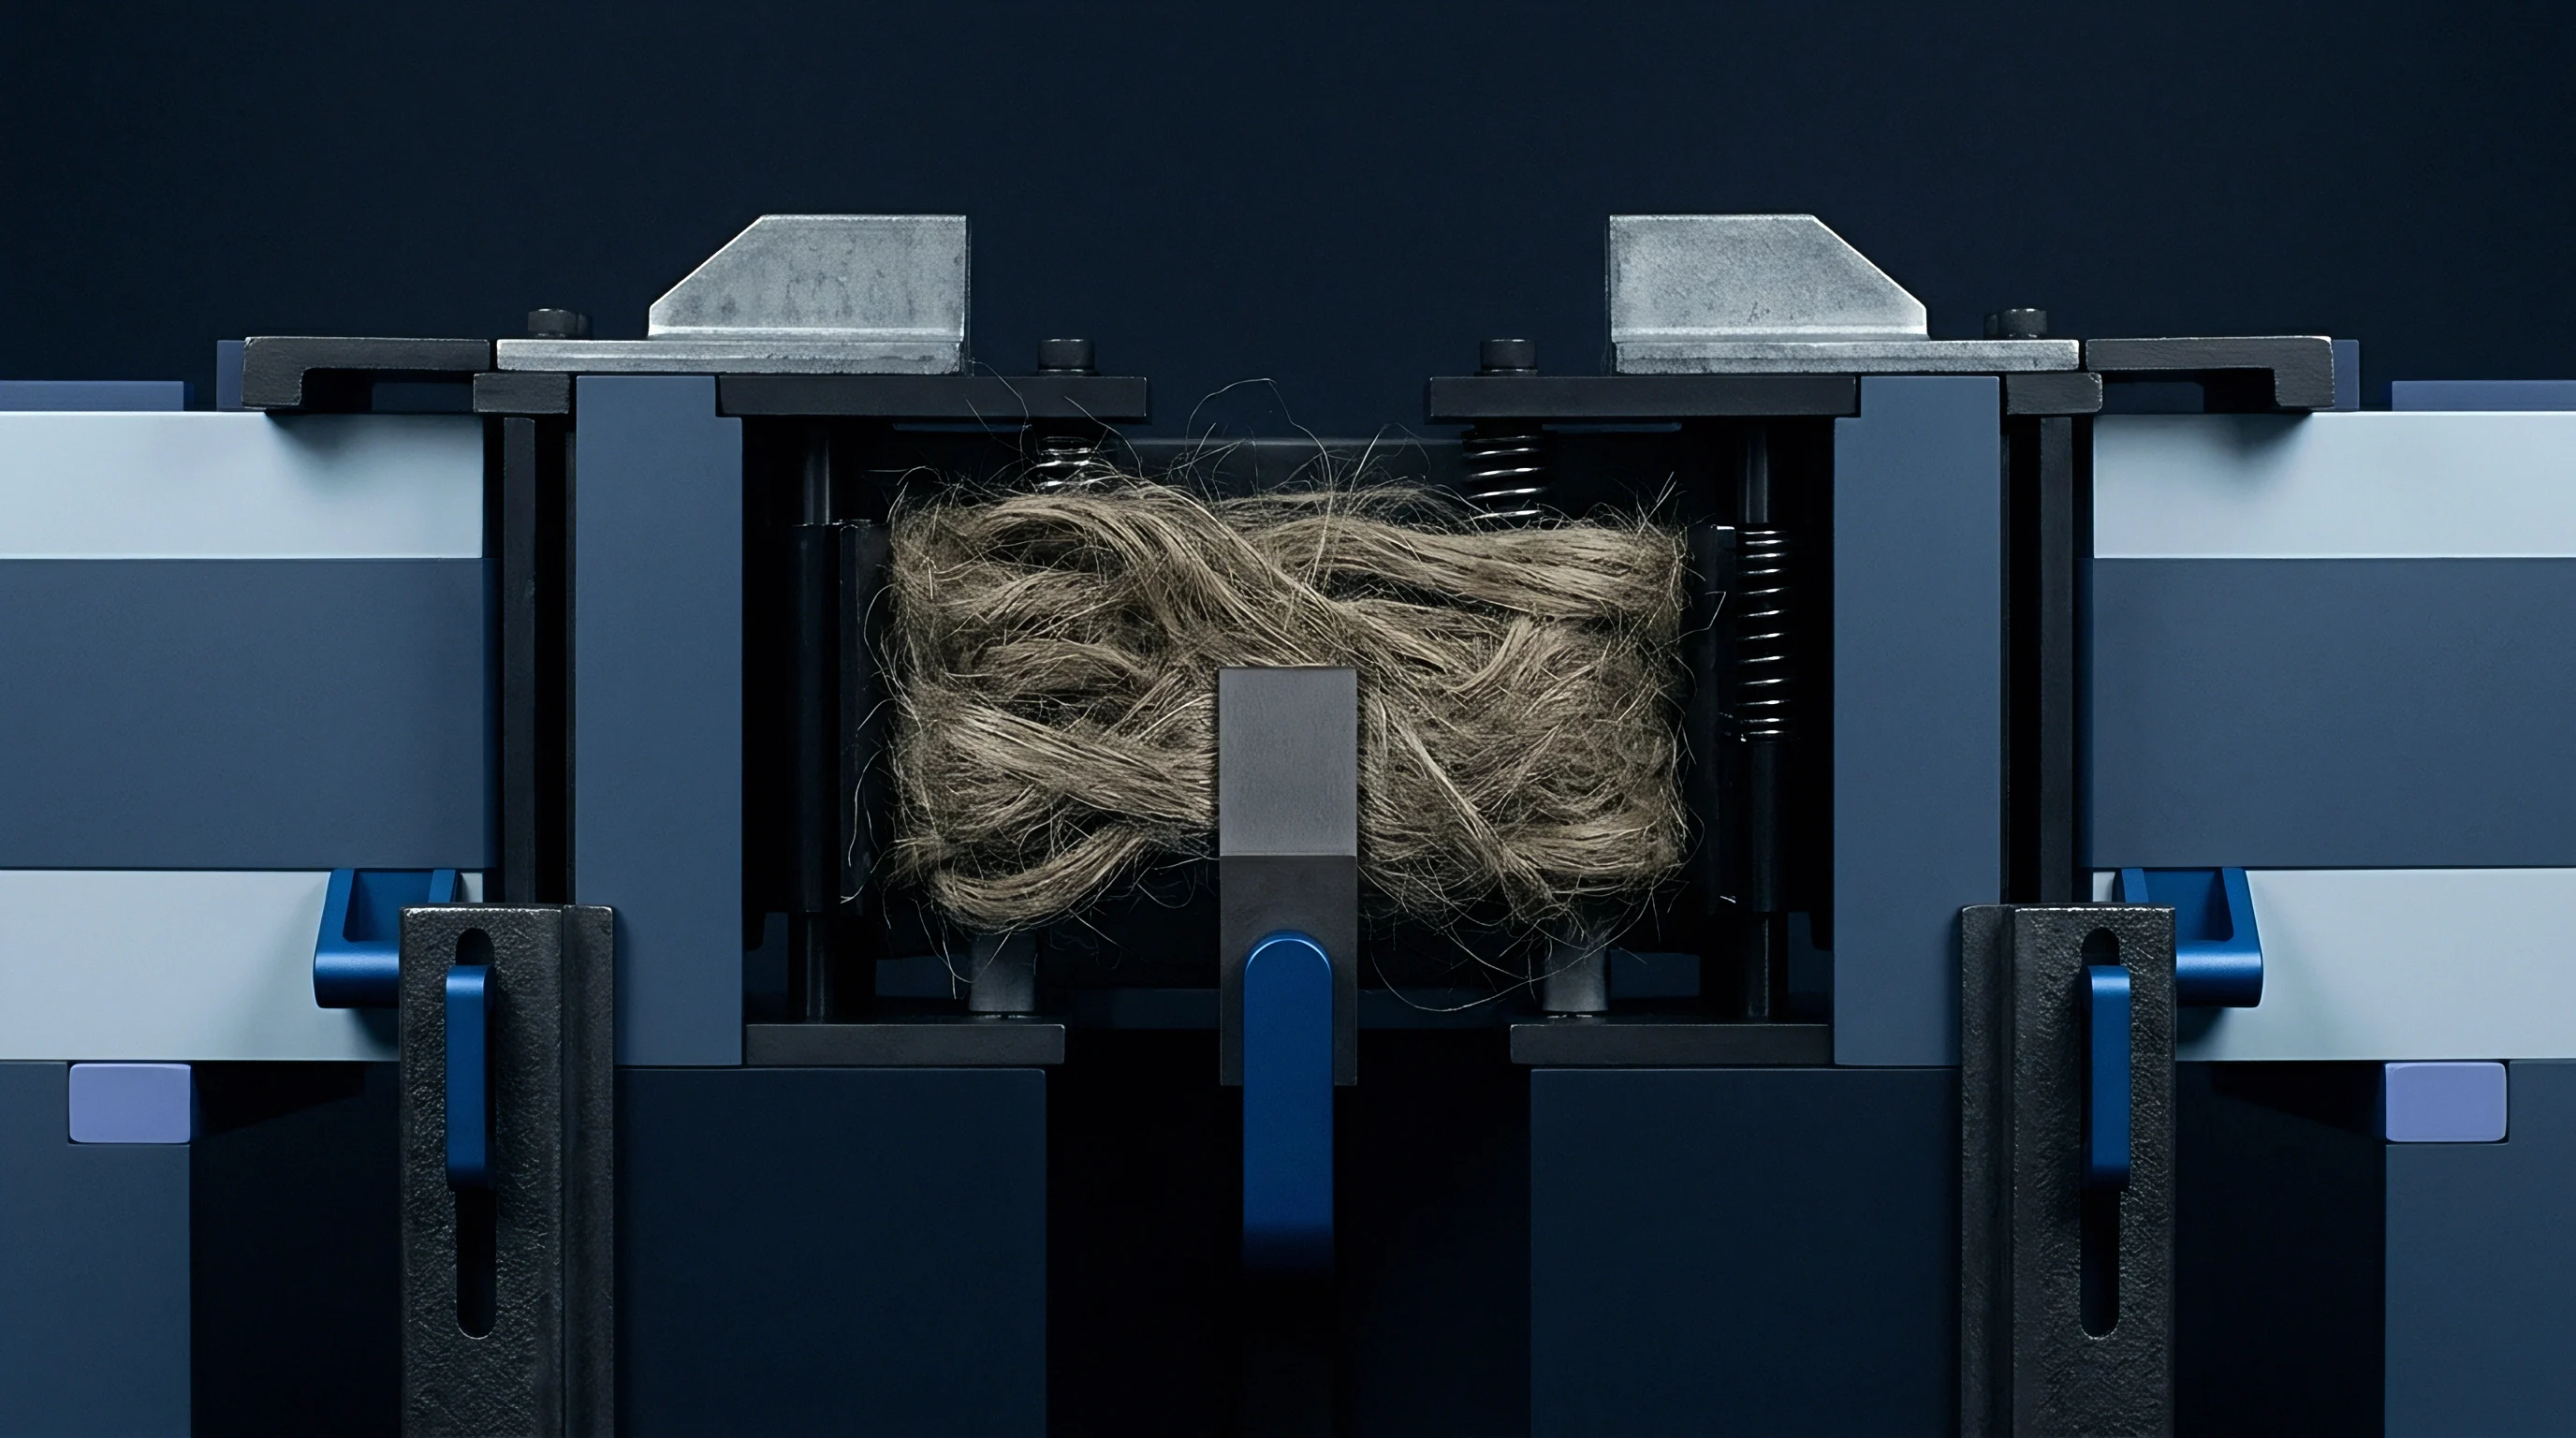
Primary bast tissue binds individual elementary fibres together with pectinaceous middle lamellae into composite bundles. Individual elementary cells measure between 10 and 40 micrometres across, with wall thicknesses spanning 4 to 12 micrometres; clusters of 10 to 40 elementary cells aggregate along the stem into a single technical fibre. Mechanical hackling splits these larger bundles by shearing the middle lamellae.
Image analysis routines must distinguish true intra-cellular lumens from the inter-cellular gaps opened up when elementary cells begin to pull apart during processing.
| Fibre Structural Level | Mean Cross Area (µm²) | Lumen Void Fraction (%) | Aspect Ratio Range | Convex Hull Circularity |
|---|---|---|---|---|
| Elementary Cell (Dew-Retted) | 180 to 450 | 2.5 to 8.0 | 1.15 to 1.45 | 0.82 to 0.91 |
| Elementary Cell (Enzyme-Retted) | 160 to 420 | 1.8 to 6.5 | 1.10 to 1.38 | 0.85 to 0.94 |
| Technical Bundle (Coarse Scutched) | 1200 to 4500 | 8.0 to 18.5 | 1.80 to 3.20 | 0.52 to 0.71 |
| Technical Bundle (Hackled Line) | 450 to 1500 | 4.0 to 12.0 | 1.40 to 2.20 | 0.68 to 0.81 |
| Data established across 500 cross-sectional optical micrographs calibrated via SEM reference scales under standard atmosphere conditions (20°C, 65% RH). | ||||
Polygonal geometry in scutched flax strands creates irregular cross sectional packing that reduces bundle density in drawn slivers.
Evaluating raw flax bundles without separating internal voids leads directly to miscalculated metric fibre numbers. High-resolution cross-sectional imaging reveals that dew-retted Chinese Heilongjiang stock retains wider lumen channels than European enzyme-retted line flax. Total enclosed area measurements that ignore lumen space skew calculated fineness downward, flattering coarse lots and disguising poor hackling yields.
These uncorrected cross-sectional profiles introduce systematic errors into fineness ratings, throwing off both yield predictions and practical spinning limits.

Lens
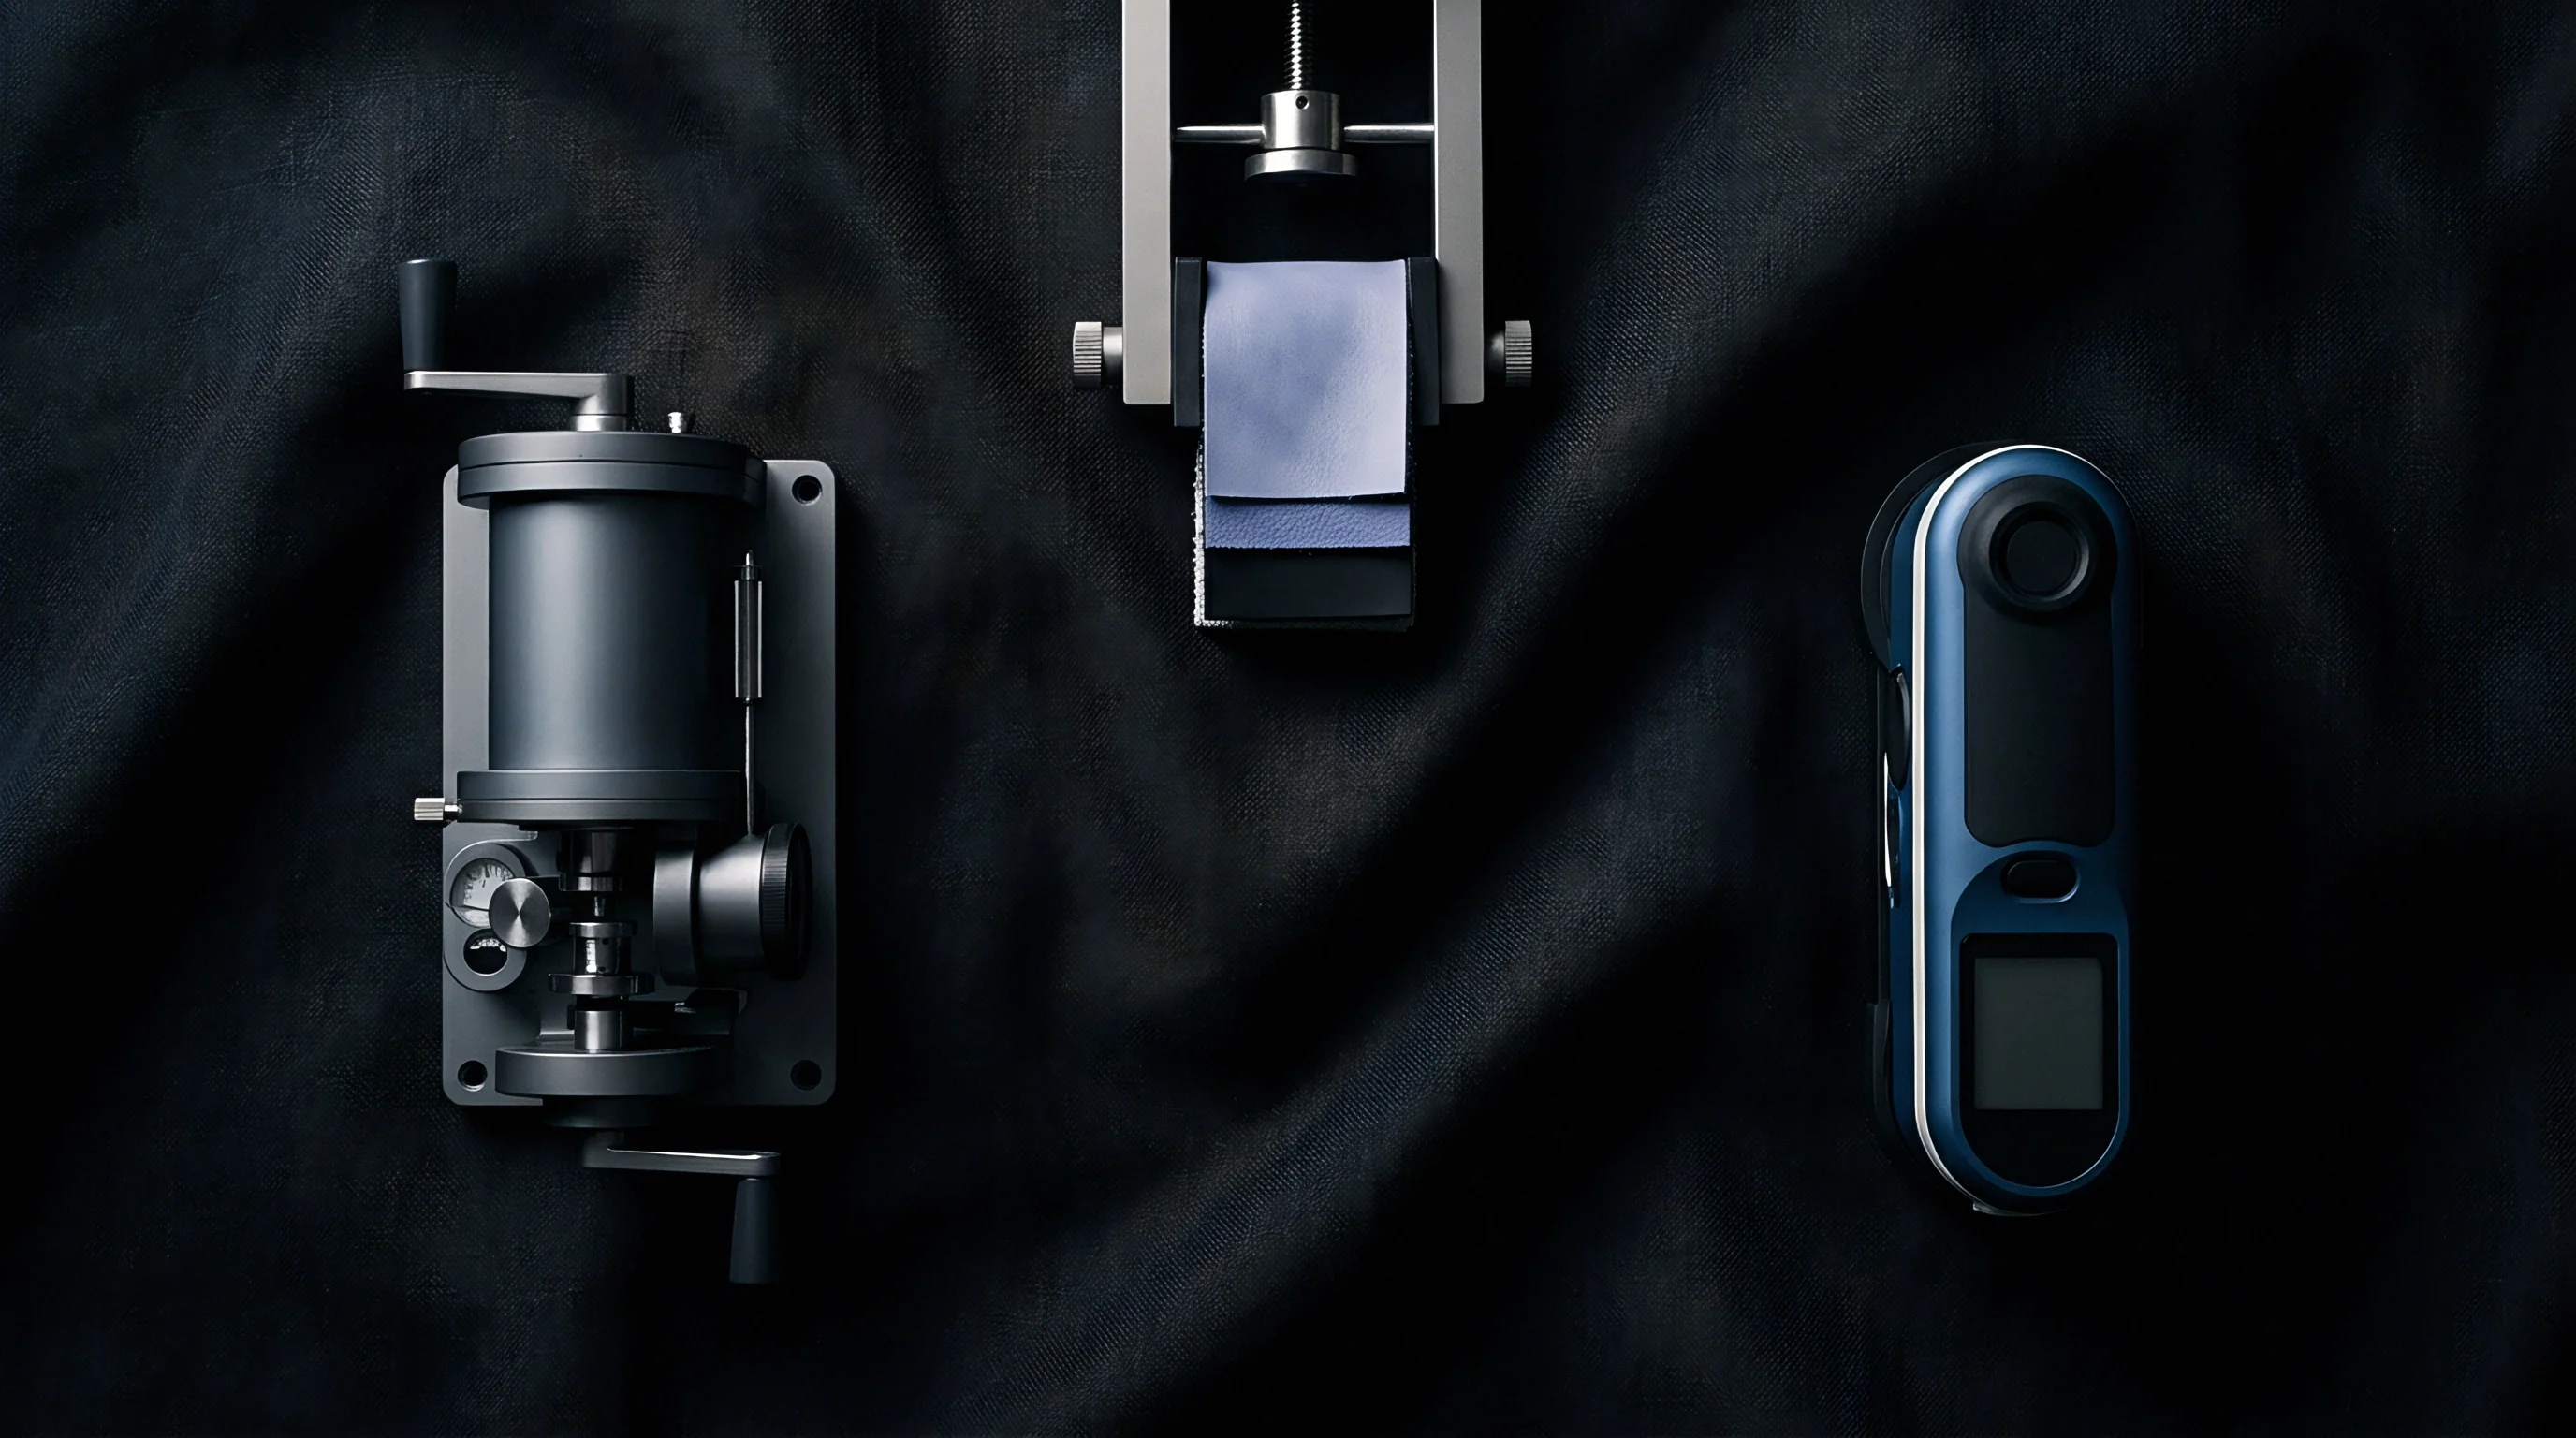
Optical and scanning electron imaging depend on clean specimen preparation to resolve cross-sectional geometry. Soft embedding media yield during microtome sectioning, smearing outer cell boundaries and obscuring edge contrast against the resin. Low-shrinkage cycloaliphatic epoxies maintain the polygonal profile of elementary cells without crushing the lumens, though shifts in resin viscosity can alter mount clarity.
Preparing clean cross-sectional specimens follows a defined physical sequence:
- Align a bundle of 50 to 100 scutched flax strands parallel inside a Teflon embedding mold.
- Pour low-viscosity cycloaliphatic epoxy resin over the aligned strands under a vacuum of 0.8 bar to remove trapped air bubbles.
- Cure the embedded resin block at 60 degrees Celsius for 18 hours until hardness reaches 85 Shore D.
- Slice transverse sections at a nominal thickness of 3.5 micrometres using a rotary microtome equipped with a tungsten carbide knife edge.
- Mount the cut section on a optical glass slide using a mounting medium matching the refractive index of cured epoxy resin at 1.54.
Under transmitted light, sections thicker than 5 micrometres generate diffraction rings that broaden perceived cell walls by 0.5 to 1.2 micrometres along each boundary. Magnification systems must achieve spatial resolutions finer than 0.25 micrometres per pixel; coarser resolutions blend narrow lumen walls into single-pixel transition bands, obscuring void boundaries and inflating apparent solid area. Sensor exposure and illumination must stay fixed across a run to prevent drift in gray-level values.
When edge blur at lower magnifications widens cell wall outlines, optical inspection systems consistently overestimate fibre fineness.


Boundary
Automated segmentation parses digital micrographs into cell walls, lumens, and background resin. Global thresholding breaks down on bast fibres because illumination and natural staining vary across the bundle. While Otsu adaptive thresholding sets local cutoffs by minimizing intra-class pixel variance, it still falters where degraded middle lamellae match the gray value of the embedding epoxy.
Segmenting outer boundaries reliably requires pairing threshold passes with gradient filters such as Sobel or Canny.
Where Does Edge Leakage Distort Fibre Tex?
Small shifts in threshold values alter extracted perimeters across a bundle. Active contour models, or snakes, counter this by drawing boundaries toward physical cell walls through an energy balance of contour smoothness and image gradients. Watershed transforms treat the gray-scale surface as topography, flooding local minima to separate touching elementary cells; without rigorous pre-filtering, however, watershed routines over-segment, splitting individual polygons into fragments.
On technical bundles bearing residual shive tissue, deep neural networks trained against manual expert annotations yield the most reliable margins.
| Segmentation Method | Mean Area Error (%) | Lumen Void Detection Accuracy (%) | Processing Time per Frame (ms) | Edge Boundary Bias |
|---|---|---|---|---|
| Global Otsu Thresholding | +14.2 | 62.5 | 45 | Overestimates boundary area |
| Adaptive Local Thresholding | +6.8 | 78.1 | 120 | Slight expansion on blurred edges |
| Marker-Controlled Watershed | -3.1 | 85.4 | 380 | Underestimates thick lamellae |
| Active Contour Models (Snakes) | +1.8 | 91.2 | 850 | Unbiased on sharp contrasts |
| U-Net Convolutional Network | +0.9 | 96.8 | 210 | Unbiased across variable retting |
Active contour segmentation achieves an area deviation under two percent when calibrated against scanning electron micrographs at two thousand times magnification.
Automated processing pipelines require validation safeguards to intercept anomalous segmentations before data enters aggregate calculations:
- Unresolved Lumen Cavities result when low contrast causes the algorithm to bridge internal cell walls, treating open void space as solid cellulose mass.
- Adjacent Cell Fusion occurs when narrow middle lamellae boundaries drop below optical resolution, merging distinct elementary fibres into oversized technical bundles.
- Resin Void Artifacts arise when air bubbles trapped in the embedding matrix mimic elementary cell geometries, generating false fibre counts.
- Shive Fragment Interference happens when residual cortical tissue exhibits high edge contrast, confusing boundary tracing routines along bundle perimeters.
- Edge Diffraction Expansion develops when thick microtome slices cause halo diffraction, adding systematic pixel rings around cell perimeters.
Correcting edge boundary bias ensures that digital fineness metrics align with spinning limits, though the exact mathematical balance between threshold adjustment and lumen void detection across diverse retting states remains an open problem.
Metrics
Converting pixel counts to physical dimensions requires metrics suited to irregular bast anatomy. Calculating equivalent diameter directly from perimeter or major axis dimensions overstates the cross-sectional area of polygonal flax. Equivalent Circle Diameter derives diameter d from enclosed polygon area A using 2 × sqrtA / π.
Equivalent Hydraulic Diameter uses 4 A / P, where P is the measured perimeter, capturing the geometry that governs air drag during drafting and liquid penetration during wet spinning.
Evaluating bundle irregularity relies on shape descriptors such as aspect ratio, roundness, and sphericity. Sphericity compares the perimeter of an equivalent circle to the measured perimeter P; where an ideal circle gives 1.0, flax fibres typically fall between 0.65 and 0.82. The convex hull ratio measures the profile against a taut boundary drawn around its extremes.
Lower convex hull values reflect deep surface indentations that increase friction between fibres during drafting.
Data from 100 scutched flax bundles demonstrates the divergence between circular models and calibrated polygonal measurements. With a maximum Feret diameter Dmax averaging 32.0 micrometres across the lot, the circular model computes cross-sectional area as:
Acirc = π × left(frac32.02right)2 = 804.25 µm2
Calibrated segmentation of the same sample traces the polygonal outline, yielding a gross enclosed area of 580.0 square micrometres. Isolating the internal lumens reveals an average void area of 45.0 square micrometres per bundle, giving a net solid cell wall area of:
Anet = 580.0 – 45.0 = 535.0 µm2
Converting solid wall area to linear density using a pure cellulose density of 1.50 grams per cubic centimetre (1.50 × 10⁻³ tex per square micrometre) gives the following result for the circular model:
1.50 × 10-3 × 804.25 = 1.206 tex
The calibrated polygonal lumen-subtracted model produces:
1.50 × 10-3 × 535.0 = 0.803 tex
The circular calculation overstates linear density by 50.2 percent. Expressed as the metric count Nm (1000 divided by tex), the circular estimate predicts a spinning limit of only 829 Nm, whereas the true cross section supports 1245 Nm. Setting drafting roller gauges around the coarser estimate introduces uneven drafting forces, creating irregular roving and pushing end breakage past 18 breaks per 100 spindle hours on wet frames. Relying on perimeter-derived areas rather than true polygonal geometry consistently misrepresents bundle mass.
Correlation
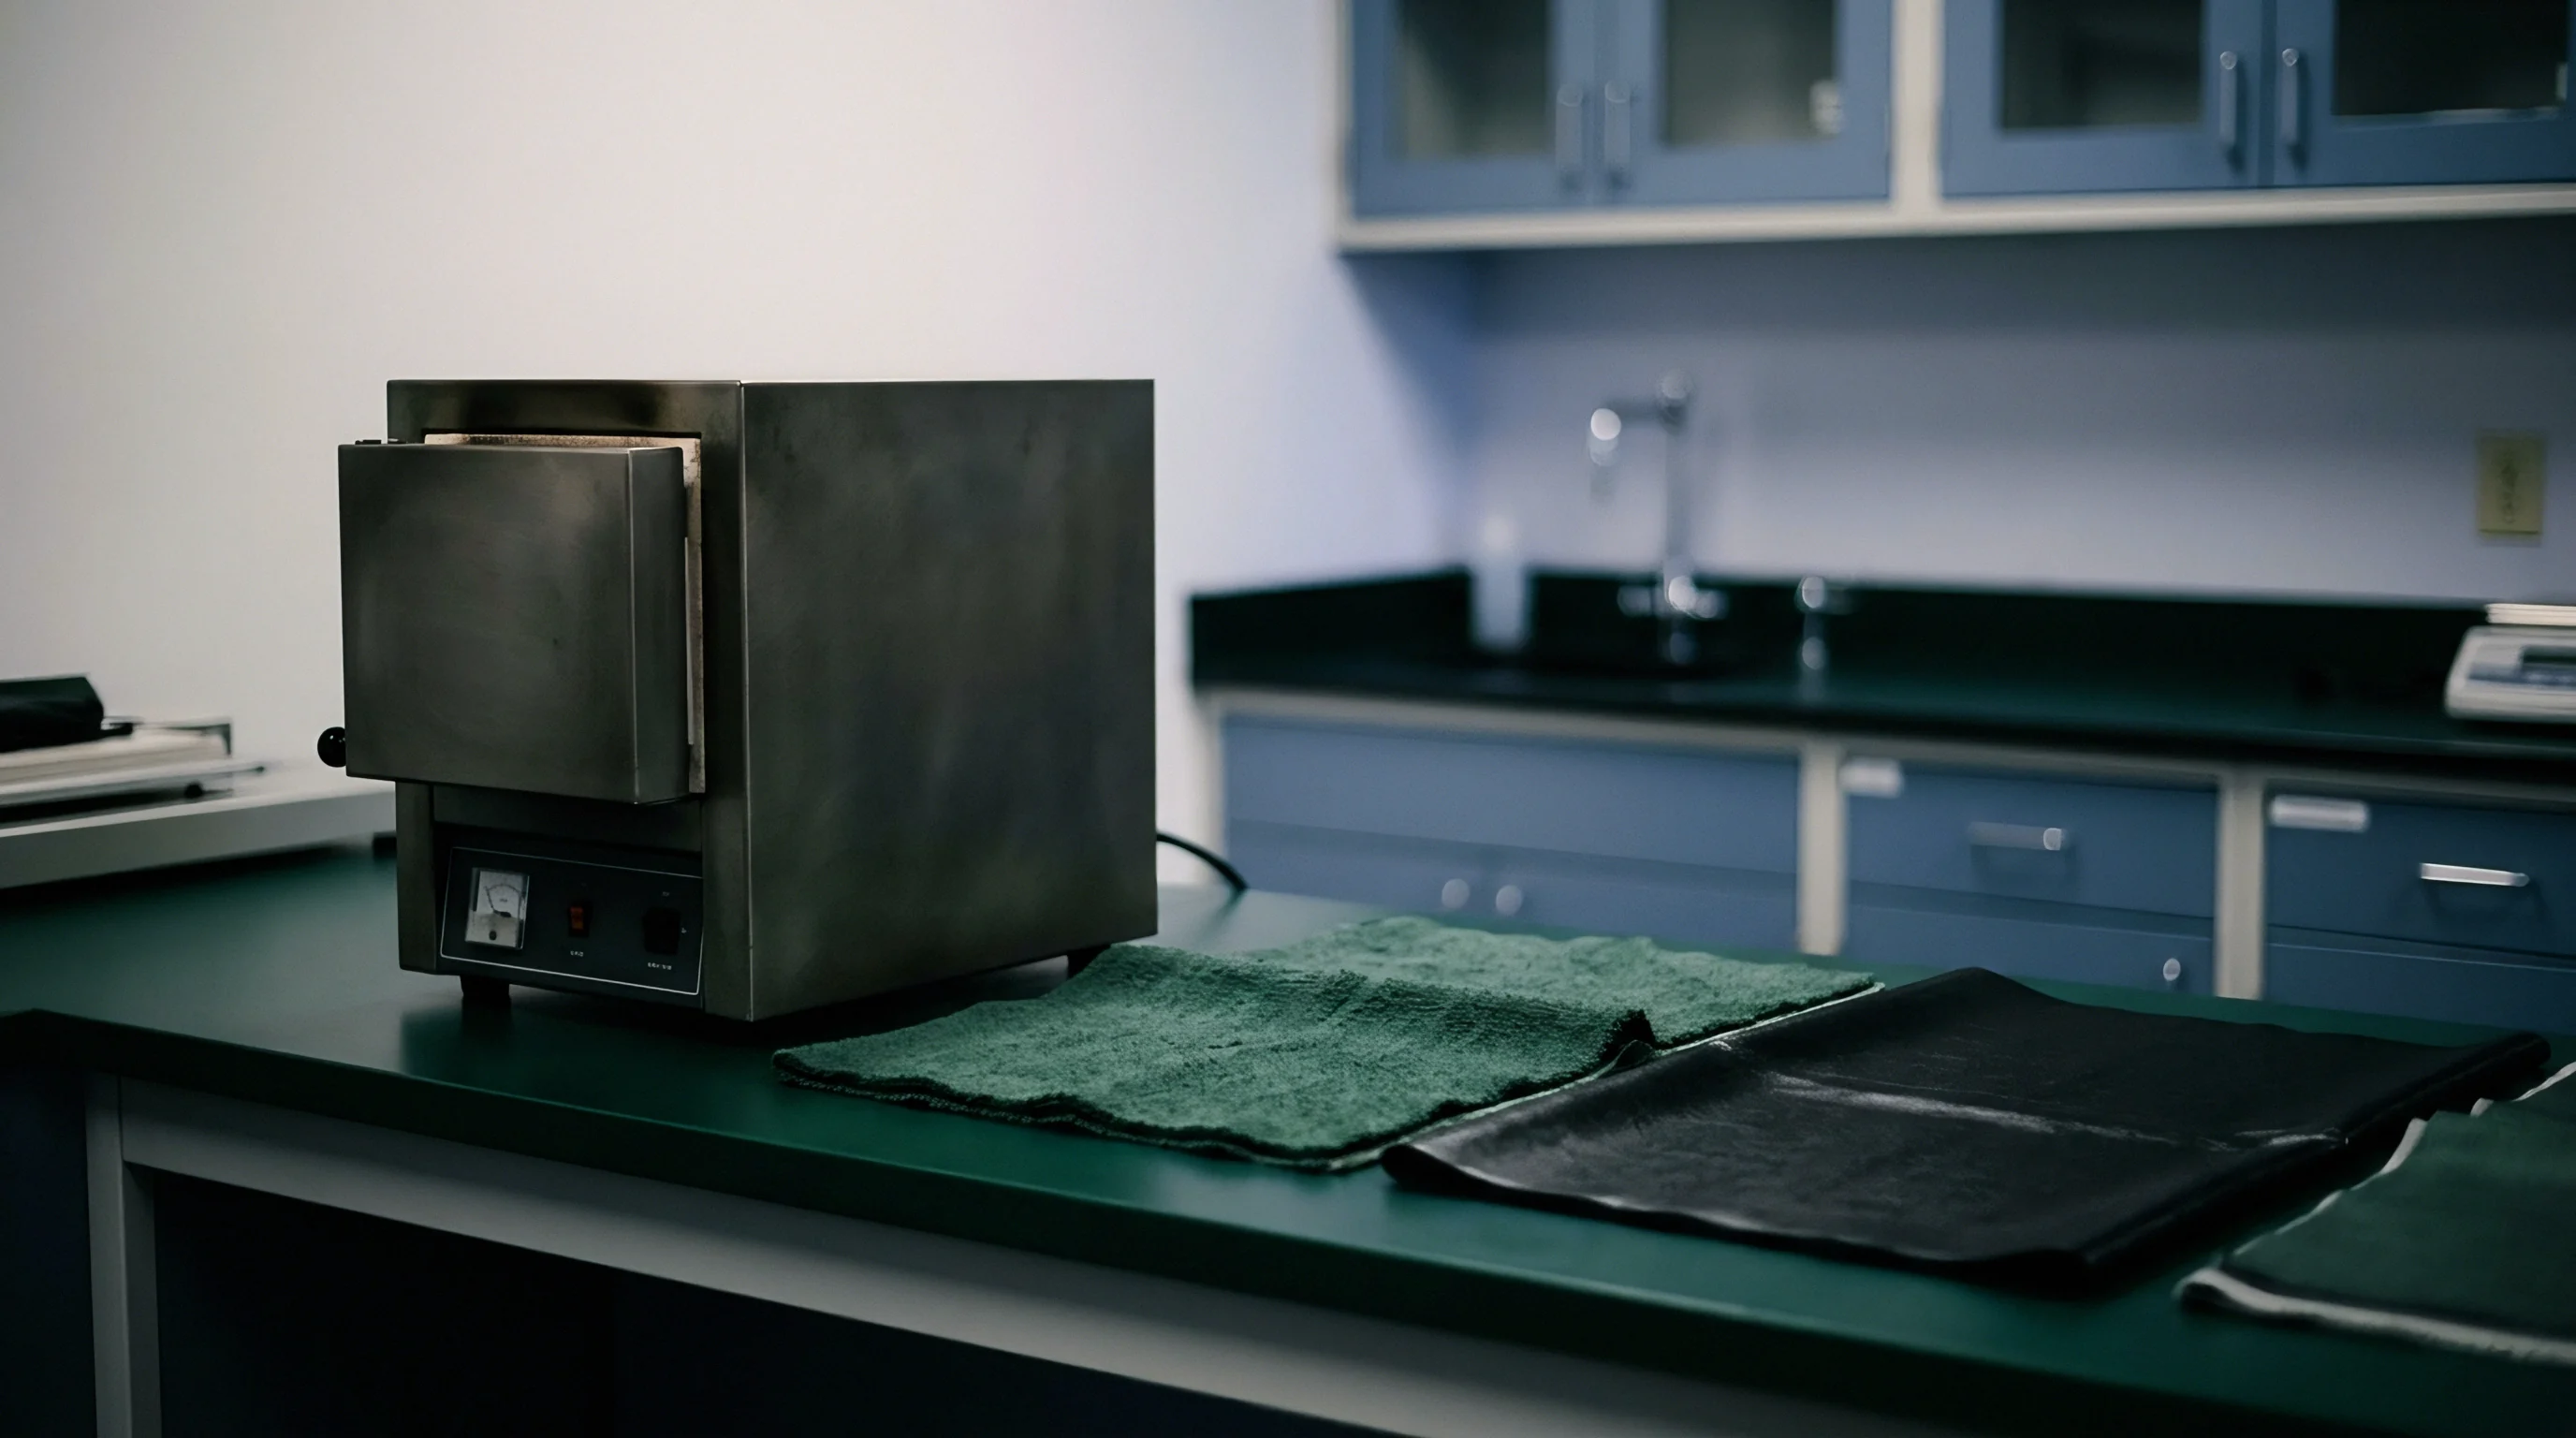
Gravimetric testing under ISO 2370 provides the reference standard for optical fineness measurements. The standard determines linear density by cutting bundles to specified lengths, weighing them on analytical microbalances, and tallying filaments under magnification. Because gravimetric tex accounts for natural cell wall density shifts directly, calibrating image algorithms requires measuring the identical bundles used in weighing trials.
Converting segmented area to tex also requires an empirical correction factor to reconcile solid cellulose density with sub-micron porosity in the secondary cell wall.
Validating digital fineness measurement protocols across commercial lots requires strict verification procedures:
- Sample Mass Conditioning under ISO 6741 mandates exposing cut fibre bundles to 20 degrees Celsius and 65 percent relative humidity for 24 hours prior to gravimetric balance weighing.
- Microtome Section Matching requires cutting cross sections from the exact mid-span region of the bundle tested under ISO 2370 to eliminate taper bias.
- Lumen Void Correction demands subtracting measured central cavity areas from total polygon area before applying cellulose polymer density multipliers.
- Porosity Factor Adjustment introduces an empirical factor between 0.94 and 0.97 to compensate for sub-micron cell wall void structures invisible to optical light microscopes.
- Gravimetric Fineness Parity verifies that digital image calculated tex remains within a plus or minus three percent tolerance band relative to ISO 2370 weighings.
Compliance with ISO 2370 gravimetric fineness standards overrides optical linear density estimates when commercial lot arbitration occurs.
Pneumatic instruments like WIRA or adapted AFIS units estimate fineness rapidly by recording the pressure drop across a compressed fibre plug. Because flow resistance responds to specific surface area, polygonal profiles generate more surface drag per unit volume than equivalent cylinders. Uncalibrated air-flow testers therefore register polygonal flax as finer than it actually is.
Linking image analysis to both ISO 2370 and ISO 1973 provides the empirical transform needed to map air-flow readings back to actual cross-sectional areas. Under contracts tied to ISO 1973, gravimetric bundle weighing supersedes optical estimates whenever readings diverge by more than five percent.

Ledger
Fineness figures from optical systems govern draft gearing and commercial yield models. When poor calibration overstates cross-sectional area, mills underestimate what a long-staple lot can spin. A lot graded at 1.2 tex under circular assumptions is routinely diverted to dry spinning for coarse 26 Nm yarns, whereas calibrated analysis showing the true 0.8 tex fineness qualifies the same crop for wet spinning into 60 Nm yarns.
| Evaluation Model | Assumed Fibre Fineness (tex) | Target Spinnable Yarn Count (Nm) | Spinning Frame End Breakage Rate (per 100 sp-hr) | Hackling & Spinning Waste Loss (%) | Delivered Yarn Cost (USD/m at 150 gsm) |
|---|---|---|---|---|---|
| Naive Circular Model (Uncalibrated) | 1.21 | 26 Nm (Dry Spun) | 22.4 | 24.5 | 0.88 |
| Perimeter Equivalent Diameter Model | 0.98 | 36 Nm (Wet Spun) | 14.8 | 18.2 | 0.72 |
| Calibrated Polygonal Model (Lumen Corrected) | 0.80 | 60 Nm (Wet Spun) | 3.2 | 11.5 | 0.54 |
Overestimating elementary fibre area leads to premature yarn breakage during high speed wet spinning.
Price spreads between coarse tow and wet-spun line yarns exceed four US dollars per kilogram. Securing French or Belgian scutched line at 4.20 US dollars per kilogram yields a profit only if the drafting layout reaches fine counts without excessive frame stops. Distorted image data leads to improper draft zone settings, raising fiber fly loss by six to ten percent.
Basing lot value on true solid cross-sectional area protects mills from paying line flax prices for crops laden with coarse bundles or intact middle lamellae, keeping target yarn counts and operating margins predictable.