Standardizing Fabric Defect Point Calculation in Automated Weaving
Automated fabric point calculations depend on spatial quantization accuracy, defect clustering logic, and width-normalized scoring to mirror ASTM D5430 standards.

Frame

Optical Acquisition Hardware on High-Speed Looms
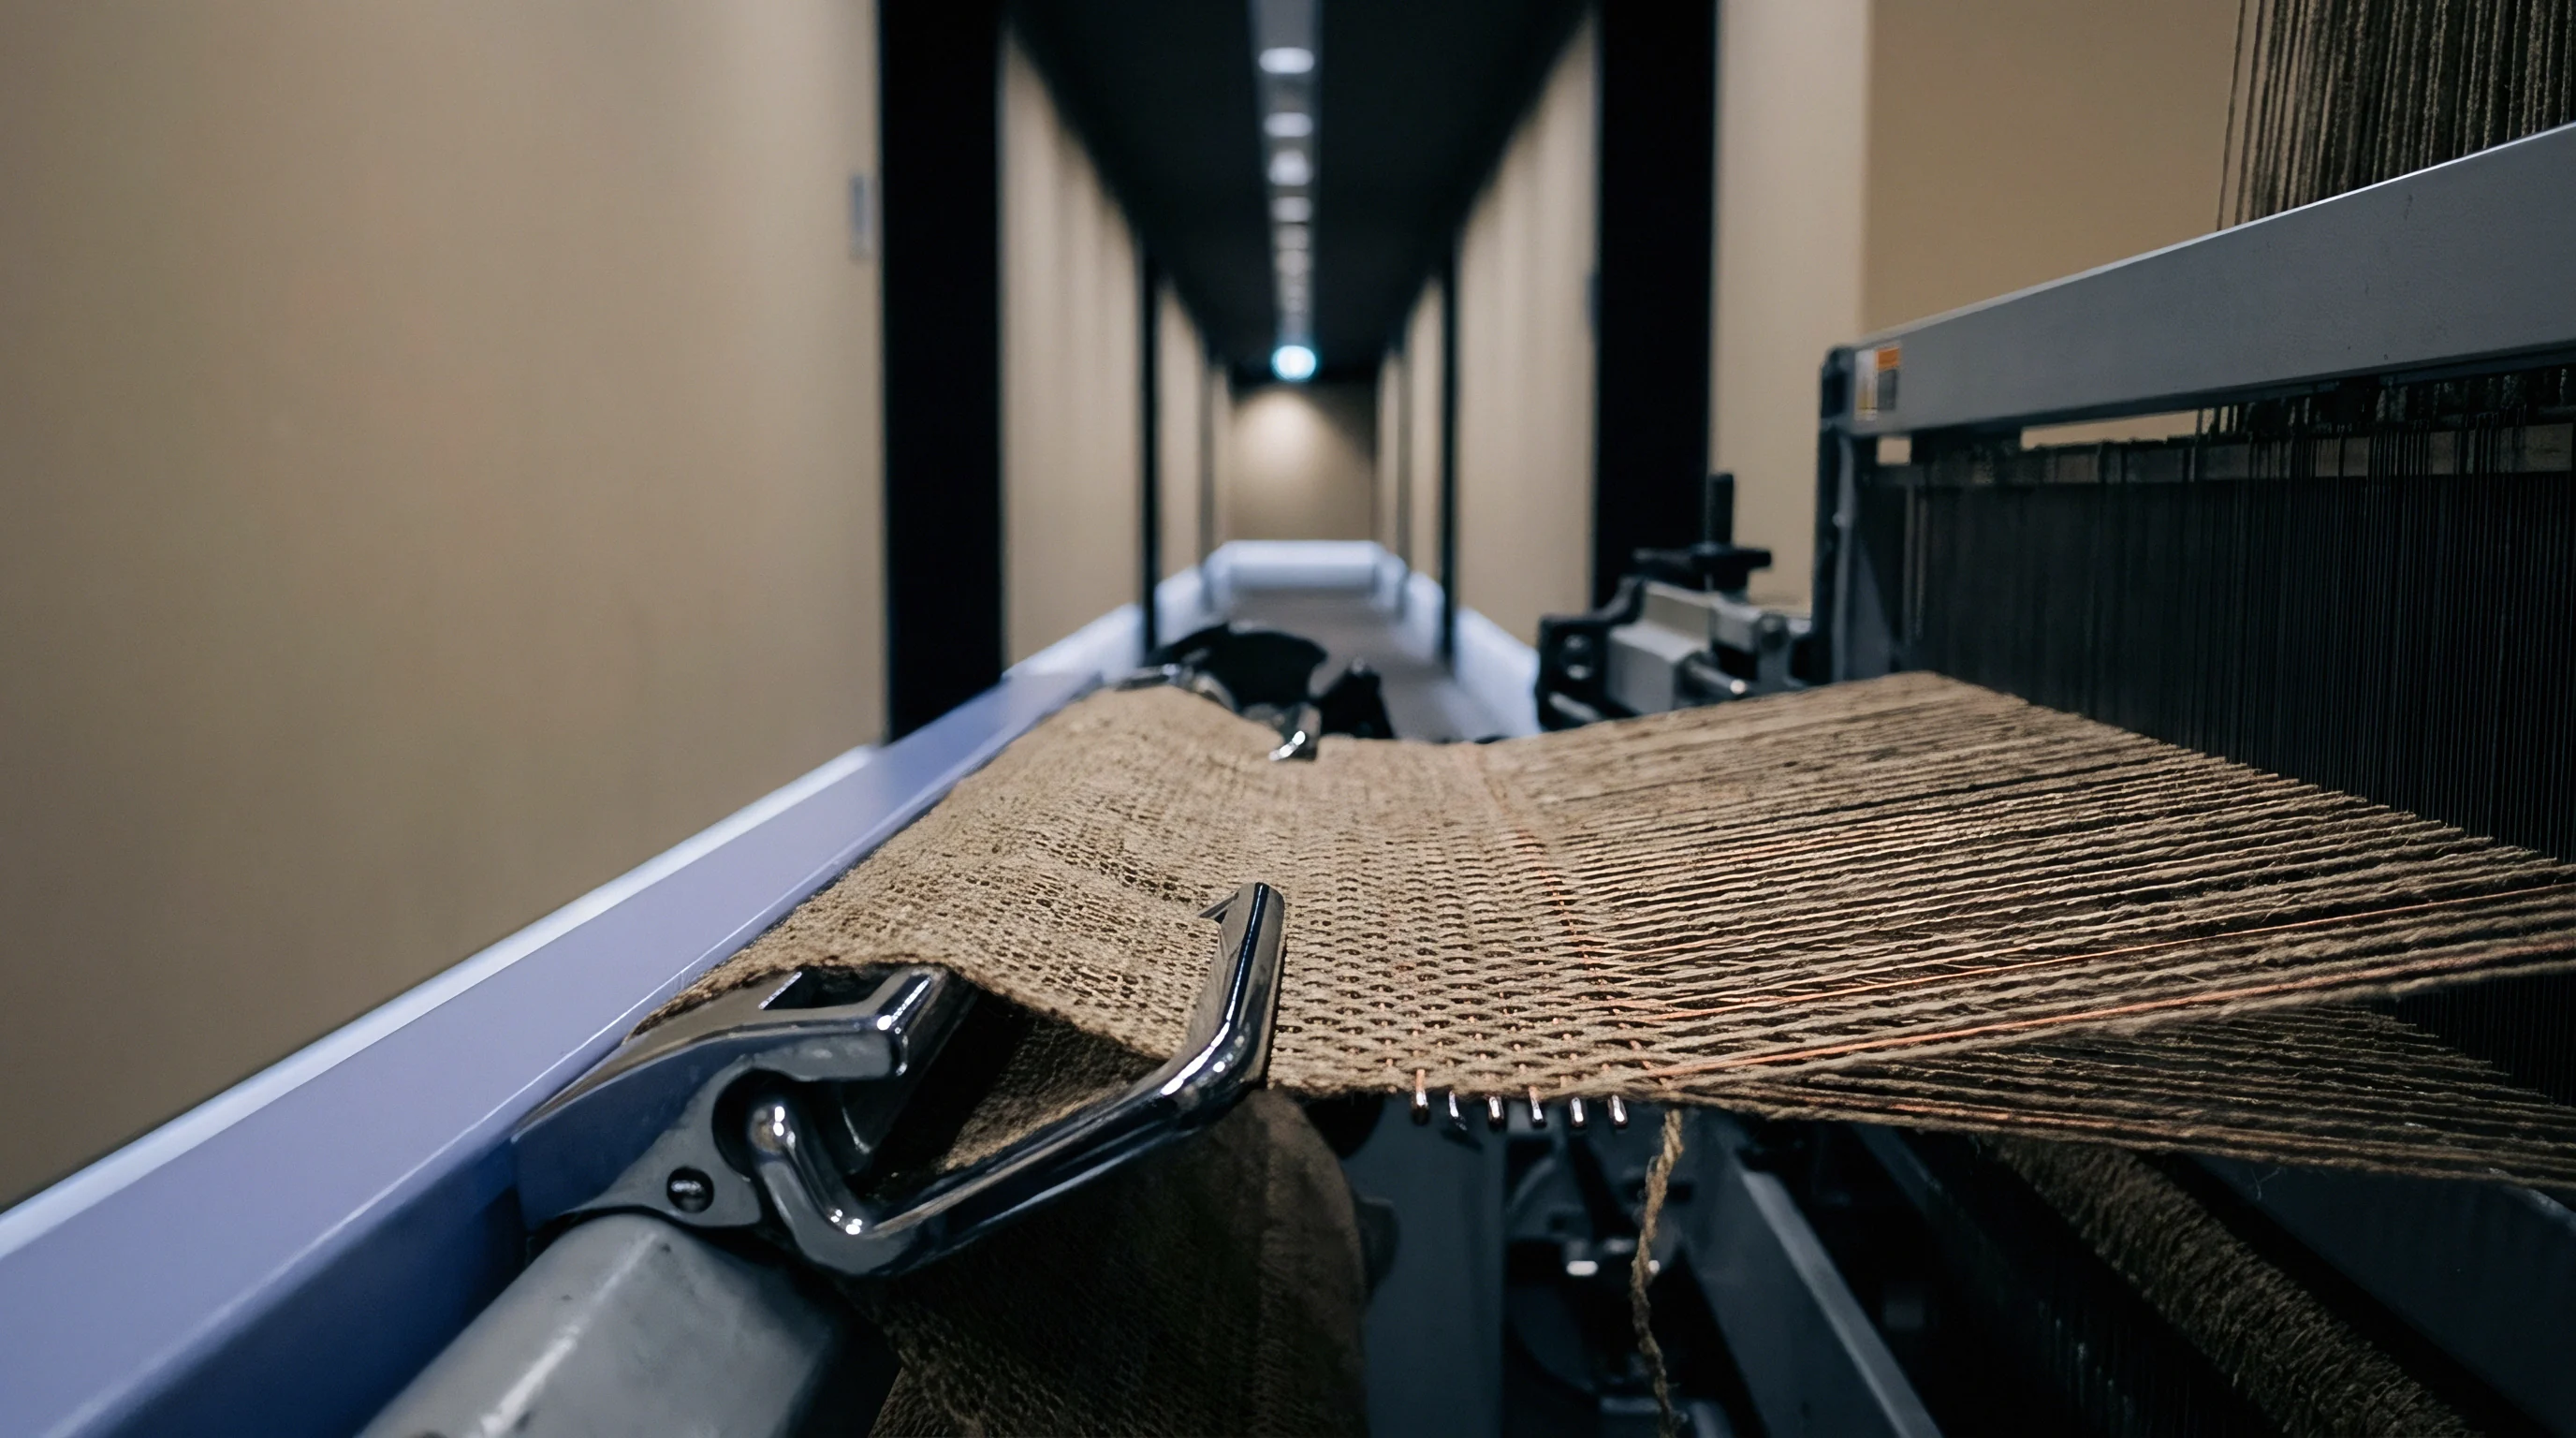
Automated visual inspection on high-speed air-jet and rapier machinery relies on continuous line-scan camera arrays mounted directly downstream of the fell line. Optical sensors record surface reflectance across the full width of the moving web at sampling rates exceeding 10,000 lines per second. Illumination balance determines the baseline signal strength.
High-frequency LED light bars positioned above and below the cloth sheet isolate structural weave gaps from surface yarn slubs. Light levels require steady output. Optical noise corrupts raw pixel matrices when dust accumulation reduces backlight intensity on open-weave linen or heavy coarse-count cotton runs.
Vibration isolation prevents mechanical slay motion from translating into image blur. Camera mountings attach to structural loom cross-beams through tuned dampening blocks, preserving sub-millimetre spatial resolution across widths reaching 340 centimetres. Spatial resolution defines the smallest detectable fault unit.
An optical setup configured for 0.15 millimetres per pixel identifies single warp end breaks at shedding speeds of 1,200 picks per minute. Broader pixel resolutions reduce processing load on machine vision processors, but finer yarn defects drop below the detection threshold.
An automated line-scan sensor operating at 1,200 picks per minute requires a minimum pixel resolution of 0.15 millimetres to detect single-end warp splits before cloth takes up onto the roll.

Sensors and Fault Acquisition Parameters
Fault capture mechanisms process incoming pixel intensity variations against a pre-compiled digital template of the weave structure. Deviations in grayscale contrast signal physical irregularities in the cloth sheet. The physical detection threshold relies on four critical sensor configuration parameters.
- Transmitted Illumination Ratio adjusts the light intensity penetrating through warp and weft intersections to highlight thin places and broken ends.
- Reflected Image Gain boosts contrast on the upper cloth surface to capture oil stains, foreign fiber inclusions, and tight weft picks.
- Spatial Line Rate syncs camera scanning velocity with the take-up motion of the loom fell to prevent image compression during speed changes.
- Grayscale Quantization Level assigns digital threshold values to pixel color shifts, separating harmless yarn hairiness from true structural defects.
Equipment manufacturers often claim that factory-default camera profiles eliminate the need for style-specific optical tuning before committing a fresh warp beam to production. Machine operators find that unadjusted optical profiles generate excessive false alarms on slubbed yarns while letting pick-finding marks pass without detection.
Scale
Quantifying Physical Fault Dimensions
Translating raw visual images into standardized defect values requires a mathematical mapping system based on physical flaw geometry. Standard defect scoring protocols, such as the widely adopted ASTM D5430 four-point system, assign penalty values based strictly on the maximum dimension of the observed fault. Spot defects occupying small surface areas receive lower point assignments, whereas continuous linear faults incur maximum penalty values once length thresholds are exceeded.
System algorithms calculate bounding boxes around identified pixel clusters to determine maximum fault dimensions. A defect measuring under 75 millimetres along its longest axis incurs a 1-point penalty. Flaws extending beyond 75 millimetres up to 150 millimetres receive 2 points.
Defects spanning between 150 millimetres and 225 millimetres accrue 3 points. Any flaw exceeding 225 millimetres in length or width triggers a 4-point assignment. Standard point assignments follow strict dimensions.
Mapping Automated Detection to Standardized Penalty Rules
Defect evaluation algorithms apply explicit penalty caps to prevent single localized fault clusters from accumulating inflated point scores. No individual linear yard or metre of cloth can accrue more than 4 total points regardless of defect count within that specific segment. Continuous defects running parallel to the warp direction demand continuous tracking logic across sequential image lines.
| Defect Category | Physical Flaw Type | Bounding Dimension Metric | Point Penalty |
|---|---|---|---|
| Spot Fault | Yarn Slub / Fly Inclusion | Length <= 75 mm | 1 Point |
| Medium Fault | Coarse Pick / Double Weft | 75 mm < Length <= 150 mm | 2 Points |
| Large Fault | Hole / Localized Float | 150 mm < Length <= 225 mm | 3 Points |
| Major Fault | Warp End Break / Reed Mark | Length > 225 mm | 4 Points |
| Continuous Fault | Running Warp Streak | Extending > 1000 mm continuously | 4 Points per Linear Yard/Metre |
Linear faults demand strict spatial tracking. When warp breaks create continuous running lines, the automated system assigns 4 points for every linear yard or metre over which the flaw persists. The system applies this calculation continuously until the loom stop motion activates or the operator clears the fault.
ASTM D5430 Clause 8.2 reclassifies any continuous warp defect exceeding three linear metres as a major fault that automatically reduces roll classification to Grade B regardless of cumulative point score.
Under international contract frameworks governed by ISO 8498, a roll containing any single defect length exceeding 300 millimetres in technical apparel end-uses triggers an immediate secondary audit, overriding automated cumulative point pass thresholds.

Logic

Algorithmic Defect Clustering and Spatial Grouping
Raw camera outputs identify hundreds of minor optical anomalies per minute, many of which represent harmless natural variations in spun yarn. Filtering software uses spatial grouping logic to merge closely spaced pixel clusters into single defect events. Merging prevents multiple counts for a single physical fault, such as a multi-end warp break that manifests across several adjacent warp threads.
Proximity parameters define the maximum pixel separation distance under which adjacent fault signals merge. If two defect clusters lie within a pre-set radius of 20 millimetres, the processing engine combines them into a single bounding box. The calculated score reflects the combined length of the merged perimeter rather than the sum of individual points.
Yarn slubs distort local contrast readings. Improper proximity settings lead to severe point over-counting on complex constructions.
Why Do High-Density Jacquard Weaves Trigger False-Positive Float Penalties during Automated Vision Analysis?
Complex structural weaves create natural surface relief and long yarn floats that alter optical reflection angles under directional light. Line-scan cameras perceive intended long floats in satins or Jacquard motifs as un-woven yarn floating across the cloth face when structural float length thresholds are misconfigured. The processing engine compares local thread interlacing frequencies against expected harness lift schedules to prevent false positives.
Configuring bounding box merging distances and optical contrast filters follows a structured calibration sequence on newly mounted weave styles.
- Run the loom at slow creep speed across two full pattern repeats to capture baseline structural gray values.
- Establish the optical contrast noise ceiling by setting signal suppression thresholds 15 percent above natural yarn hairy variance.
- Set warp-wise merging distance to 25 millimetres to bundle multi-end warp break clusters into single defect events.
- Set weft-wise merging distance to 10 millimetres to isolate isolated weft loops from full-width pick anomalies.
- Input maximum acceptable float length based on the weave draft sheet to prevent valid weave floats from triggering defect flags.
- Validate clustering output against visual inspection of a five-metre greige sample roll taken directly behind the take-up motion.
Floating threads create false positive flags. High pick densities obscure small structural faults. Setting filter thresholds too high allows genuine short floats to pass undetected through the automated scoring stream.
Dark-dyed high-density weft yarn masks structural floats on the loom frame that become instantly visible once greige cloth undergoes wet processing.
Dynamic contrast thresholding adjusts baseline image acceptance criteria in real time as loom speed changes, ensuring inspection consistency during machine ramp-up and deceleration phases.


Norm

Width Normalization Mechanics and Mathematical Standardisation
Comparing fabric quality across different roll widths and total production lengths requires converting raw accumulated point totals into standard density metrics. Raw defect counts carry little commercial meaning unless evaluated against total surface area inspected. Standard commercial practice expresses fabric defect density as total points per 100 square yards or total points per 100 square metres.
In imperial calculations, total points awarded multiply by a constant factor of 3,600, divided by the product of overall roll width in inches and total roll length in yards. In metric calculations, total accumulated points multiply by 10,000, divided by the product of cut fabric width in centimetres and total roll length in metres. Uncalibrated sensors inflate defect totals.
Wide looms increase inspection complexity.
Consider a practical comparison involving three distinct weaving setups running different constructions and widths under automated optical monitoring.
Scenario A evaluates a plain-weave cotton poplin running on a 160-centimetre loom beam. The automated vision system records 28 total penalty points across a finished roll length of 120 metres. Applying the metric formula yields a normalized score of 14.58 points per 100 square metres.
Scenario B evaluates a 3/1 heavy twill workwear cloth running on a broad 320-centimetre rapier loom. The camera array records 42 total points across a 120-metre roll. Although the absolute point count appears significantly higher than Scenario A, the broad width provides double the surface area per linear metre.
Applying the metric formula yields a normalized score of 10.93 points per 100 square metres.
Scenario C evaluates a fine 2/2 twill linen shirtings running at 190 centimetres width. Over a 100-metre production roll, the system detects 35 total points. The resulting score equals 18.42 points per 100 square metres.
| Construction Profile | Roll Width | Roll Length | Raw System Points | Points per 100 sq Metres | Commercial Grade Status |
|---|---|---|---|---|---|
| 100% Cotton Plain Poplin (110 x 60) | 160 cm | 120 m | 28 | 14.58 | Grade A (Pass) |
| Poly/Cotton 3/1 Twill Workwear | 320 cm | 120 m | 42 | 10.93 | Grade A (Pass) |
| 100% Fine Linen 2/2 Twill | 190 cm | 100 m | 35 | 18.42 | Grade B (Allowance) |
| High-Density Nylon Taffeta | 150 cm | 200 m | 54 | 18.00 | Grade B (Allowance) |
| Standard Grade A acceptance ceiling fixed at 15.00 points per 100 square metres under contract conditions. | |||||
Correct calibration preserves margin expectations. Errors in roll width data entry distort final square-metre point calculations, causing acceptable broad-width rolls to receive false commercial rejections while under-width rolls pass with unacceptable defect densities.
Camera calibration drifts under loom vibration unless optical mounting bars isolate sensor arrays from the main slay movement.
Misapplying unadjusted linear point totals instead of width-normalized point densities leads directly to incorrect debit notes and invalid supply contract rejections.

Variance

Discrepancies between Automated Vision and Manual Off-Loom Inspection
Disagreements between mill automated scoring reports and third-party manual inspection logs represent a persistent source of commercial friction. Manual inspection tables operate at lower speeds, typically 15 to 25 metres per minute, under fixed overhead light angles. Human inspectors rely on physical tactile feedback and variable viewing angles to evaluate flaw severity.
Automated camera arrays evaluate optical contrast under strict perpendicular lighting at full loom production speeds.
Static optical cameras miss shallow tension variations that create visual shading without altering surface grayscale contrast. Fine warp-way double ends often pass automated camera checks on heavy textured yarns, yet human inspectors register these flaws immediately under indirect light. Conversely, camera systems capture micro-slubs and tiny foreign fiber fly that human eyes routinely miss during fast manual roll passes.

Auditing Automated Point Calculation Software Calibration
Technical auditors evaluate machine vision scoring accuracy prior to accepting automated inspection receipts for final commercial settlement.
- Optical Focus Calibration verifies that pixel spatial scaling remains uniform across the full width of the camera array from left selvedge to right selvedge.
- Grayscale Contrast Verification confirms that lighting decay does not blind edge cameras relative to center-cloth cameras.
- Fault Map Cross-Checking matches digital defect coordinate maps against physical chalk markers applied to greige cloth roll edges.
- Slub Suppression Thresholding checks that natural slubs in coarse-count spun linen do not accumulate false point counts.
- Length Counter Accuracy tests physical wheel encoders against digital line counts to prevent roll length distortion in point normalization formulas.
Discrepancy rates between automated and manual scoring methods typically range from 8 to 14 percent on standard plain and twill grey goods. What specific threshold of optical contrast variance justifies overriding automated inspection records in favor of manual re-inspection? That question remains a subject of ongoing debate between weaving sheds and commercial buying houses.

Settlement

Commercial Contract Integration and Penalty Clauses
Integrating automated point calculation systems into procurement contracts requires defining clear numerical standards for roll classification, financial allowances, and full lot rejection. Standard commercial contracts establish Grade A status for cloth possessing a normalized defect score below 15 points per 100 square metres or 20 points per 100 square yards. Rolls recording between 15 and 28 points per 100 square metres incur financial price deductions, while rolls exceeding 28 points face outright rejection.
Automated inspection software generates a digital defect map for every completed roll, logging the exact spatial coordinates, physical dimensions, and assigned points for every detected flaw. Buyers insert contractual clauses specifying that any single continuous defect extending over three metres automatically reclassifies the entire roll as Grade B regardless of total normalized points. Contract terms define whether automated loom-head defect maps serve as binding settlement documentation or whether off-loom inspection frame re-runs take precedence during billing disputes.
Financial allowances calculate directly from normalized point metrics. A roll earning 22 points per 100 square metres incurs a calculated 5 percent debit note against invoice price to compensate apparel cutting rooms for layout adjustments around identified defect coordinates. When defect density forces cutting tables to reduce pattern yield by more than 8 percent, buyers apply full roll return clauses.
Unresolved defect disputes delay mill invoice clearance and consume valuable loom capacity through repeated re-inspection cycles.